|
Download Data (XLS File) |
|
||||||||
|
||||||||
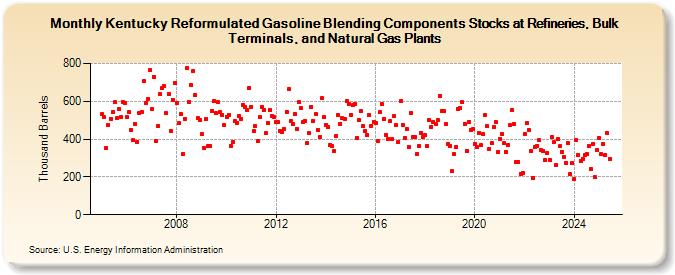
| Kentucky Reformulated Gasoline Blending Components Stocks at Refineries, Bulk Terminals, and Natural Gas Plants (Thousand Barrels) | ||||||||
| Year | Jan | Feb | Mar | Apr | May | Jun | Jul | Aug | Sep | Oct | Nov | Dec |
|---|---|---|---|---|---|---|---|---|---|---|---|---|
| 2005 | 532 | 516 | 355 | 476 | 507 | 543 | 594 | 509 | 558 | 517 | 595 | 592 |
| 2006 | 515 | 542 | 450 | 393 | 480 | 384 | 537 | 544 | 705 | 593 | 611 | 765 |
| 2007 | 561 | 730 | 390 | 468 | 637 | 672 | 679 | 538 | 640 | 445 | 607 | 697 |
| 2008 | 589 | 483 | 531 | 322 | 508 | 775 | 598 | 684 | 760 | 632 | 509 | 503 |
| 2009 | 426 | 352 | 504 | 362 | 364 | 551 | 599 | 536 | 597 | 541 | 528 | 473 |
| 2010 | 517 | 526 | 366 | 383 | 494 | 487 | 520 | 508 | 581 | 571 | 554 | 671 |
| 2011 | 571 | 443 | 469 | 388 | 515 | 570 | 552 | 430 | 487 | 555 | 523 | 517 |
| 2012 | 488 | 490 | 442 | 436 | 454 | 544 | 665 | 494 | 482 | 534 | 455 | 596 |
| 2013 | 562 | 489 | 498 | 377 | 430 | 572 | 497 | 533 | 450 | 410 | 615 | 516 |
| 2014 | 477 | 464 | 371 | 364 | 337 | 417 | 529 | 482 | 509 | 507 | 601 | 586 |
| 2015 | 530 | 578 | 587 | 408 | 500 | 548 | 468 | 445 | 420 | 526 | 471 | 491 |
| 2016 | 484 | 390 | 542 | 584 | 508 | 424 | 398 | 494 | 400 | 520 | 473 | 386 |
| 2017 | 600 | 476 | 405 | 455 | 359 | 538 | 413 | 413 | 322 | 366 | 434 | 412 |
| 2018 | 420 | 363 | 502 | 466 | 490 | 481 | 499 | 628 | 549 | 547 | 478 | 374 |
| 2019 | 365 | 229 | 319 | 357 | 557 | 564 | 596 | 479 | 339 | 492 | 447 | 453 |
| 2020 | 376 | 360 | 434 | 367 | 425 | 529 | 467 | 348 | 378 | 462 | 490 | 334 |
| 2021 | 401 | 427 | 377 | 334 | 369 | 473 | 555 | 479 | 281 | 279 | 218 | 223 |
| 2022 | 428 | 483 | 446 | 336 | 196 | 360 | 365 | 393 | 341 | 336 | 290 | 325 |
| 2023 | 291 | 410 | 383 | 263 | 399 | 361 | 332 | 306 | 276 | 379 | 213 | 274 |
| 2024 | 188 | |||||||||||
| - = No Data Reported; -- = Not Applicable; NA = Not Available; W = Withheld to avoid disclosure of individual company data. |
| Release Date: 3/29/2024 |
| Next Release Date: 4/30/2024 |