|
Download Data (XLS File) |
|
||||||||
|
||||||||
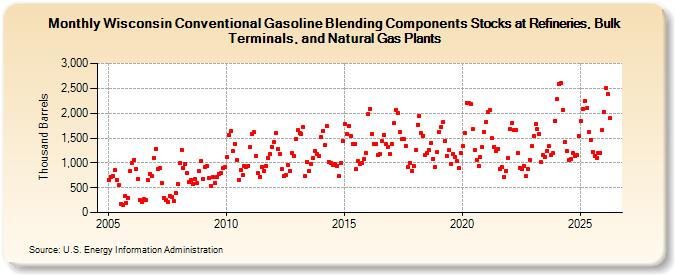
| Wisconsin Conventional Gasoline Blending Components Stocks at Refineries, Bulk Terminals, and Natural Gas Plants (Thousand Barrels) | ||||||||
| Year | Jan | Feb | Mar | Apr | May | Jun | Jul | Aug | Sep | Oct | Nov | Dec |
|---|---|---|---|---|---|---|---|---|---|---|---|---|
| 2005 | 662 | 725 | 732 | 860 | 665 | 552 | 163 | 149 | 335 | 201 | 295 | 831 |
| 2006 | 1,006 | 1,062 | 886 | 676 | 262 | 222 | 266 | 254 | 649 | 783 | 736 | 1,106 |
| 2007 | 1,289 | 884 | 897 | 590 | 303 | 244 | 215 | 336 | 323 | 241 | 399 | 576 |
| 2008 | 996 | 1,268 | 904 | 982 | 799 | 605 | 655 | 582 | 667 | 586 | 827 | 1,038 |
| 2009 | 680 | 910 | 933 | 693 | 538 | 711 | 601 | 713 | 781 | 804 | 889 | 915 |
| 2010 | 1,116 | 1,551 | 1,633 | 1,234 | 1,385 | 1,050 | 652 | 859 | 762 | 944 | 923 | 943 |
| 2011 | 1,322 | 1,580 | 1,612 | 1,140 | 788 | 725 | 914 | 833 | 939 | 1,096 | 1,186 | 1,329 |
| 2012 | 1,412 | 1,596 | 1,273 | 1,188 | 872 | 735 | 751 | 963 | 841 | 1,202 | 1,129 | 1,476 |
| 2013 | 1,655 | 1,602 | 1,589 | 1,718 | 729 | 1,018 | 839 | 982 | 1,100 | 1,242 | 1,173 | 1,137 |
| 2014 | 1,518 | 1,651 | 1,355 | 1,739 | 1,020 | 1,004 | 964 | 975 | 941 | 738 | 1,001 | 1,436 |
| 2015 | 1,780 | 1,575 | 1,733 | 1,541 | 1,384 | 1,378 | 870 | 1,031 | 987 | 996 | 1,075 | 1,190 |
| 2016 | 1,983 | 2,094 | 1,583 | 1,382 | 1,388 | 1,152 | 1,171 | 1,436 | 1,552 | 1,377 | 1,326 | 1,170 |
| 2017 | 1,376 | 1,796 | 2,069 | 2,007 | 1,625 | 1,473 | 1,486 | 1,348 | 922 | 1,007 | 842 | 932 |
| 2018 | 1,258 | 1,768 | 1,950 | 1,591 | 1,546 | 1,157 | 1,196 | 1,251 | 1,404 | 1,084 | 920 | 1,218 |
| 2019 | 1,631 | 1,725 | 1,824 | 1,445 | 1,140 | 1,263 | 987 | 1,175 | 1,121 | 1,030 | 893 | 1,200 |
| 2020 | 1,336 | 1,605 | 2,212 | 2,196 | 2,178 | 1,675 | 1,252 | 1,065 | 940 | 1,120 | 1,311 | 1,617 |
| 2021 | 1,831 | 2,023 | 2,062 | 1,493 | 1,322 | 1,247 | 1,281 | 873 | 911 | 722 | 842 | 1,088 |
| 2022 | 1,680 | 1,800 | 1,655 | 1,664 | 1,202 | 893 | 867 | 946 | 728 | 871 | 1,063 | 1,334 |
| 2023 | 1,539 | 1,782 | 1,678 | 1,581 | 1,010 | 1,150 | 1,113 | 1,241 | 1,323 | 1,158 | 1,196 | 1,829 |
| 2024 | 2,267 | |||||||||||
| - = No Data Reported; -- = Not Applicable; NA = Not Available; W = Withheld to avoid disclosure of individual company data. |
| Release Date: 3/29/2024 |
| Next Release Date: 4/30/2024 |