|
Download Data (XLS File) |
|
||||||||
|
||||||||
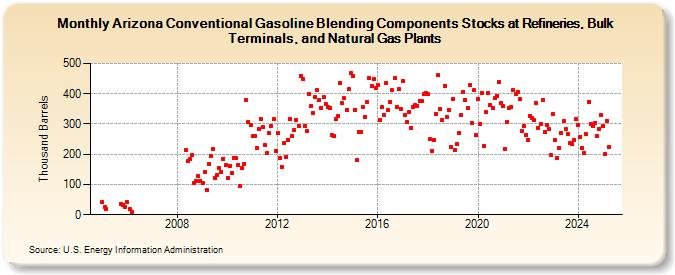
| Arizona Conventional Gasoline Blending Components Stocks at Refineries, Bulk Terminals, and Natural Gas Plants (Thousand Barrels) | ||||||||
| Year | Jan | Feb | Mar | Apr | May | Jun | Jul | Aug | Sep | Oct | Nov | Dec |
|---|---|---|---|---|---|---|---|---|---|---|---|---|
| 2005 | 41 | 25 | 18 | 34 | 33 | 26 | ||||||
| 2006 | 41 | 18 | 10 | |||||||||
| 2008 | 214 | 179 | 184 | 197 | 106 | 111 | 128 | 111 | ||||
| 2009 | 104 | 142 | 83 | 167 | 194 | 218 | 123 | 132 | 156 | 142 | 185 | 163 |
| 2010 | 122 | 161 | 137 | 188 | 186 | 164 | 94 | 154 | 167 | 379 | 306 | 298 |
| 2011 | 260 | 260 | 221 | 284 | 318 | 290 | 230 | 203 | 269 | 294 | 316 | 209 |
| 2012 | 269 | 186 | 158 | 237 | 192 | 248 | 317 | 261 | 281 | 312 | 292 | 460 |
| 2013 | 449 | 294 | 276 | 400 | 361 | 335 | 389 | 411 | 380 | 353 | 389 | 367 |
| 2014 | 357 | 352 | 265 | 259 | 317 | 327 | 436 | 368 | 385 | 347 | 415 | 467 |
| 2015 | 458 | 346 | 180 | 274 | 274 | 357 | 324 | 372 | 451 | 426 | 448 | 419 |
| 2016 | 428 | 312 | 355 | 330 | 434 | 345 | 372 | 411 | 451 | 356 | 416 | 351 |
| 2017 | 443 | 329 | 305 | 339 | 287 | 357 | 362 | 360 | 377 | 376 | 398 | 402 |
| 2018 | 399 | 250 | 209 | 247 | 334 | 461 | 349 | 314 | 425 | 323 | 346 | 224 |
| 2019 | 383 | 215 | 233 | 271 | 331 | 407 | 380 | 352 | 428 | 304 | 411 | 262 |
| 2020 | 383 | 300 | 403 | 227 | 340 | 403 | 362 | 352 | 387 | 394 | 440 | 369 |
| 2021 | 359 | 217 | 308 | 353 | 356 | 411 | 398 | 407 | 381 | 276 | 294 | 263 |
| 2022 | 248 | 328 | 321 | 312 | 369 | 288 | 300 | 378 | 274 | 296 | 284 | 198 |
| 2023 | 334 | 247 | 188 | 222 | 270 | 309 | 282 | 267 | 237 | 235 | 246 | 315 |
| 2024 | 298 | |||||||||||
| - = No Data Reported; -- = Not Applicable; NA = Not Available; W = Withheld to avoid disclosure of individual company data. |
| Release Date: 3/29/2024 |
| Next Release Date: 4/30/2024 |