|
Download Data (XLS File) |
|
||||||||
|
||||||||
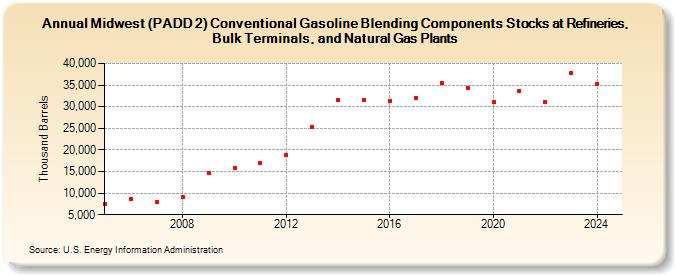
| Midwest (PADD 2) Conventional Gasoline Blending Components Stocks at Refineries, Bulk Terminals, and Natural Gas Plants (Thousand Barrels) | ||||||||
| Decade | Year-0 | Year-1 | Year-2 | Year-3 | Year-4 | Year-5 | Year-6 | Year-7 | Year-8 | Year-9 |
|---|---|---|---|---|---|---|---|---|---|---|
| 2000's | 7,588 | 8,725 | 7,875 | 9,005 | 14,658 | |||||
| 2010's | 15,918 | 16,957 | 18,900 | 25,225 | 31,625 | 31,548 | 31,392 | 32,030 | 35,385 | 34,432 |
| 2020's | 31,006 | 33,727 | 31,128 | 37,908 |
| - = No Data Reported; -- = Not Applicable; NA = Not Available; W = Withheld to avoid disclosure of individual company data. |
| Release Date: 3/29/2024 |
| Next Release Date: 8/30/2024 |