|
Download Data (XLS File) |
|
||||||||
|
||||||||
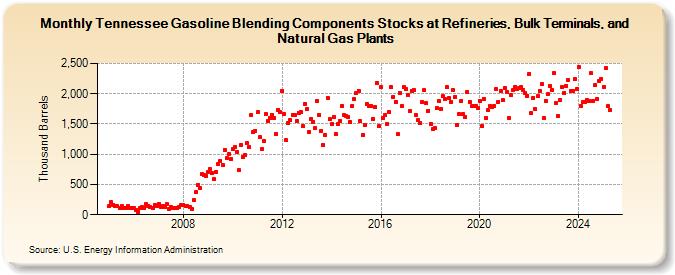
| Tennessee Gasoline Blending Components Stocks at Refineries, Bulk Terminals, and Natural Gas Plants (Thousand Barrels) | ||||||||
| Year | Jan | Feb | Mar | Apr | May | Jun | Jul | Aug | Sep | Oct | Nov | Dec |
|---|---|---|---|---|---|---|---|---|---|---|---|---|
| 2005 | 137 | 202 | 166 | 147 | 143 | 114 | 140 | 105 | 106 | 143 | 103 | 106 |
| 2006 | 107 | 82 | 51 | 108 | 122 | 116 | 173 | 150 | 122 | 112 | 167 | 147 |
| 2007 | 183 | 132 | 146 | 131 | 173 | 96 | 122 | 110 | 106 | 103 | 131 | 157 |
| 2008 | 164 | 147 | 146 | 121 | 92 | 240 | 378 | 499 | 437 | 666 | 653 | 648 |
| 2009 | 712 | 751 | 683 | 586 | 702 | 846 | 889 | 828 | 1,076 | 932 | 1,007 | 921 |
| 2010 | 1,085 | 1,121 | 1,029 | 735 | 1,159 | 952 | 986 | 1,182 | 1,116 | 1,651 | 1,370 | 1,390 |
| 2011 | 1,691 | 1,278 | 1,079 | 1,226 | 1,661 | 1,550 | 1,605 | 1,651 | 1,603 | 1,337 | 1,738 | 1,695 |
| 2012 | 2,047 | 1,661 | 1,230 | 1,508 | 1,565 | 1,651 | 1,651 | 1,550 | 1,684 | 1,697 | 1,464 | 1,835 |
| 2013 | 1,747 | 1,373 | 1,579 | 1,537 | 1,427 | 1,886 | 1,646 | 1,385 | 1,147 | 1,316 | 1,932 | 1,574 |
| 2014 | 1,497 | 1,620 | 1,328 | 1,498 | 1,553 | 1,805 | 1,644 | 1,639 | 1,615 | 1,538 | 1,799 | 1,915 |
| 2015 | 2,017 | 2,052 | 1,542 | 1,322 | 1,475 | 1,828 | 1,802 | 1,801 | 1,582 | 1,784 | 2,176 | 1,463 |
| 2016 | 2,118 | 1,598 | 1,646 | 1,497 | 1,701 | 2,104 | 1,946 | 1,871 | 1,330 | 2,008 | 1,801 | 2,103 |
| 2017 | 2,085 | 1,983 | 1,714 | 2,050 | 2,058 | 1,650 | 1,562 | 1,510 | 1,862 | 2,054 | 1,839 | 1,719 |
| 2018 | 1,505 | 1,414 | 1,431 | 1,758 | 1,876 | 1,745 | 1,955 | 1,917 | 2,107 | 1,930 | 1,865 | 2,057 |
| 2019 | 1,951 | 1,486 | 1,660 | 1,884 | 1,661 | 1,614 | 2,025 | 1,870 | 1,791 | 1,800 | 1,804 | 1,771 |
| 2020 | 1,877 | 1,470 | 1,918 | 1,599 | 1,724 | 1,796 | 1,779 | 1,798 | 2,072 | 1,871 | 2,041 | 1,889 |
| 2021 | 2,091 | 2,025 | 1,591 | 1,972 | 2,057 | 2,110 | 2,073 | 2,094 | 2,109 | 2,058 | 2,010 | 1,968 |
| 2022 | 2,327 | 1,680 | 1,933 | 1,744 | 1,964 | 2,045 | 2,158 | 1,600 | 1,879 | 1,989 | 2,131 | 2,063 |
| 2023 | 2,313 | 1,844 | 1,634 | 1,897 | 2,110 | 2,014 | 2,131 | 2,228 | 2,048 | 2,043 | 2,241 | 2,078 |
| 2024 | 2,443 | |||||||||||
| - = No Data Reported; -- = Not Applicable; NA = Not Available; W = Withheld to avoid disclosure of individual company data. |
| Release Date: 3/29/2024 |
| Next Release Date: 4/30/2024 |