|
Download Data (XLS File) |
|
||||||||
|
||||||||
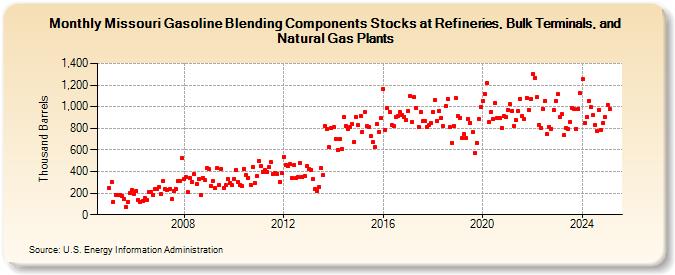
| Missouri Gasoline Blending Components Stocks at Refineries, Bulk Terminals, and Natural Gas Plants (Thousand Barrels) | ||||||||
| Year | Jan | Feb | Mar | Apr | May | Jun | Jul | Aug | Sep | Oct | Nov | Dec |
|---|---|---|---|---|---|---|---|---|---|---|---|---|
| 2005 | 243 | 305 | 122 | 187 | 178 | 184 | 172 | 148 | 71 | 121 | 197 | 231 |
| 2006 | 195 | 224 | 138 | 120 | 125 | 153 | 137 | 212 | 209 | 179 | 239 | 241 |
| 2007 | 256 | 189 | 311 | 236 | 231 | 234 | 141 | 215 | 240 | 310 | 315 | 523 |
| 2008 | 327 | 351 | 207 | 337 | 301 | 374 | 283 | 332 | 178 | 343 | 318 | 429 |
| 2009 | 420 | 267 | 309 | 247 | 432 | 276 | 425 | 249 | 272 | 332 | 292 | 271 |
| 2010 | 327 | 415 | 303 | 278 | 265 | 426 | 366 | 344 | 279 | 443 | 298 | 358 |
| 2011 | 500 | 453 | 399 | 414 | 393 | 438 | 484 | 379 | 388 | 378 | 305 | 385 |
| 2012 | 537 | 463 | 447 | 466 | 341 | 456 | 342 | 352 | 482 | 350 | 363 | 448 |
| 2013 | 421 | 415 | 327 | 240 | 222 | 258 | 434 | 367 | 819 | 795 | 624 | 801 |
| 2014 | 808 | 705 | 597 | 701 | 611 | 908 | 819 | 795 | 808 | 842 | 676 | 904 |
| 2015 | 826 | 917 | 769 | 951 | 820 | 813 | 733 | 674 | 624 | 843 | 768 | 894 |
| 2016 | 1,163 | 786 | 985 | 953 | 833 | 824 | 908 | 912 | 950 | 926 | 903 | 876 |
| 2017 | 964 | 1,100 | 857 | 1,086 | 987 | 816 | 949 | 864 | 868 | 815 | 831 | 850 |
| 2018 | 954 | 1,060 | 868 | 960 | 898 | 817 | 1,002 | 1,072 | 808 | 668 | 824 | 1,078 |
| 2019 | 916 | 899 | 712 | 749 | 708 | 884 | 851 | 764 | 567 | 667 | 885 | 999 |
| 2020 | 1,052 | 1,118 | 1,218 | 854 | 955 | 885 | 1,035 | 895 | 896 | 806 | 910 | 904 |
| 2021 | 971 | 1,021 | 959 | 823 | 878 | 961 | 1,072 | 910 | 886 | 1,085 | 973 | 1,067 |
| 2022 | 1,298 | 1,269 | 1,086 | 834 | 806 | 981 | 1,055 | 743 | 815 | 797 | 971 | 1,054 |
| 2023 | 1,058 | 865 | 924 | 734 | 806 | 796 | 860 | 987 | 975 | 797 | 983 | 1,123 |
| 2024 | 1,254 | |||||||||||
| - = No Data Reported; -- = Not Applicable; NA = Not Available; W = Withheld to avoid disclosure of individual company data. |
| Release Date: 3/29/2024 |
| Next Release Date: 4/30/2024 |