|
Download Data (XLS File) |
|
||||||||
|
||||||||
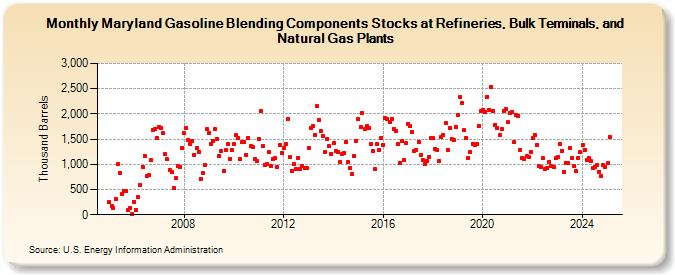
| Maryland Gasoline Blending Components Stocks at Refineries, Bulk Terminals, and Natural Gas Plants (Thousand Barrels) | ||||||||
| Year | Jan | Feb | Mar | Apr | May | Jun | Jul | Aug | Sep | Oct | Nov | Dec |
|---|---|---|---|---|---|---|---|---|---|---|---|---|
| 2005 | 252 | 165 | 134 | 319 | 1,005 | 822 | 404 | 466 | 467 | 96 | 135 | 9 |
| 2006 | 262 | 95 | 345 | 587 | 941 | 1,167 | 768 | 779 | 1,076 | 1,689 | 1,705 | 1,514 |
| 2007 | 1,747 | 1,711 | 1,619 | 1,208 | 1,098 | 895 | 839 | 532 | 731 | 965 | 949 | 1,324 |
| 2008 | 1,623 | 1,716 | 1,488 | 1,399 | 1,453 | 1,194 | 1,328 | 1,251 | 714 | 832 | 996 | 1,695 |
| 2009 | 1,619 | 1,406 | 1,456 | 1,697 | 1,506 | 1,163 | 1,256 | 866 | 1,275 | 1,394 | 1,106 | 1,274 |
| 2010 | 1,409 | 1,586 | 1,527 | 1,110 | 1,444 | 1,433 | 1,193 | 1,522 | 1,366 | 1,343 | 1,105 | 1,056 |
| 2011 | 1,500 | 2,057 | 1,362 | 983 | 997 | 1,239 | 974 | 1,112 | 1,118 | 946 | 1,382 | 1,234 |
| 2012 | 1,333 | 1,398 | 1,894 | 1,138 | 869 | 1,010 | 905 | 1,133 | 912 | 971 | 925 | 917 |
| 2013 | 1,325 | 1,728 | 1,753 | 1,585 | 2,150 | 1,885 | 1,661 | 1,555 | 1,245 | 1,510 | 1,355 | 1,213 |
| 2014 | 1,420 | 1,268 | 1,239 | 1,036 | 1,195 | 1,232 | 1,446 | 1,044 | 935 | 813 | 1,164 | 1,464 |
| 2015 | 1,890 | 1,737 | 2,020 | 1,704 | 1,750 | 1,712 | 1,397 | 1,270 | 905 | 1,395 | 1,292 | 1,530 |
| 2016 | 1,390 | 1,910 | 1,901 | 1,841 | 1,897 | 1,699 | 1,669 | 1,412 | 1,033 | 1,463 | 1,080 | 1,416 |
| 2017 | 1,802 | 1,760 | 1,641 | 1,259 | 1,278 | 1,446 | 1,183 | 1,085 | 1,000 | 1,067 | 1,137 | 1,520 |
| 2018 | 1,516 | 1,311 | 1,274 | 1,066 | 1,551 | 1,581 | 1,815 | 1,284 | 1,714 | 1,494 | 1,479 | 1,739 |
| 2019 | 1,973 | 2,342 | 2,216 | 1,674 | 1,513 | 1,132 | 1,247 | 1,410 | 1,388 | 1,402 | 1,760 | 2,058 |
| 2020 | 2,079 | 2,033 | 2,344 | 2,083 | 2,529 | 2,054 | 1,786 | 1,715 | 1,576 | 1,705 | 2,063 | 2,089 |
| 2021 | 1,831 | 2,020 | 2,032 | 1,441 | 1,970 | 1,966 | 1,290 | 1,132 | 1,099 | 1,155 | 1,150 | 1,240 |
| 2022 | 1,527 | 1,576 | 1,377 | 976 | 939 | 1,117 | 902 | 928 | 1,053 | 965 | 956 | 1,117 |
| 2023 | 1,142 | 1,403 | 1,248 | 842 | 1,030 | 1,026 | 1,321 | 1,116 | 961 | 860 | 1,132 | 1,235 |
| 2024 | 1,391 | 1,292 | 1,082 | 1,119 | ||||||||
| - = No Data Reported; -- = Not Applicable; NA = Not Available; W = Withheld to avoid disclosure of individual company data. |
| Release Date: 6/28/2024 |
| Next Release Date: 7/31/2024 |