|
Download Data (XLS File) |
|
||||||||
|
||||||||
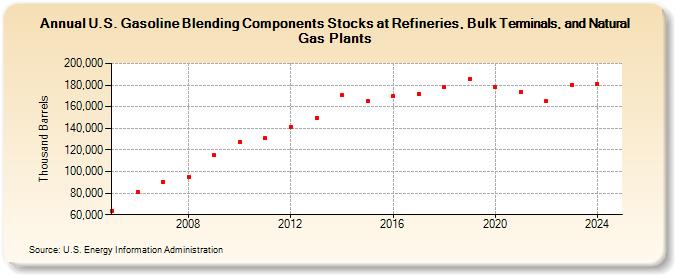
| U.S. Gasoline Blending Components Stocks at Refineries, Bulk Terminals, and Natural Gas Plants (Thousand Barrels) | ||||||||
| Decade | Year-0 | Year-1 | Year-2 | Year-3 | Year-4 | Year-5 | Year-6 | Year-7 | Year-8 | Year-9 |
|---|---|---|---|---|---|---|---|---|---|---|
| 2000's | 63,827 | 81,114 | 90,707 | 94,918 | 114,995 | |||||
| 2010's | 127,573 | 130,602 | 141,628 | 149,944 | 170,442 | 165,123 | 169,495 | 172,132 | 177,770 | 185,838 |
| 2020's | 177,851 | 173,724 | 164,961 | 180,559 |
| - = No Data Reported; -- = Not Applicable; NA = Not Available; W = Withheld to avoid disclosure of individual company data. |
| Release Date: 3/29/2024 |
| Next Release Date: 8/30/2024 |