|
Download Data (XLS File) |
|
||||||||
|
||||||||
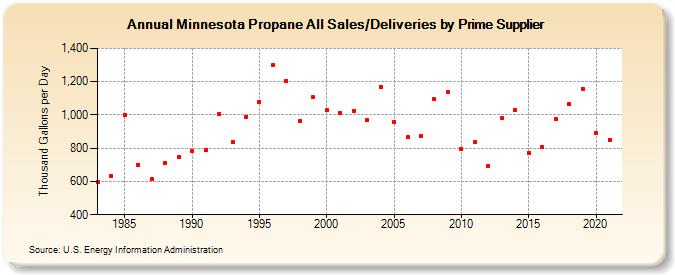
| Minnesota Propane All Sales/Deliveries by Prime Supplier (Thousand Gallons per Day) | ||||||||
| Decade | Year-0 | Year-1 | Year-2 | Year-3 | Year-4 | Year-5 | Year-6 | Year-7 | Year-8 | Year-9 |
|---|---|---|---|---|---|---|---|---|---|---|
| 1980's | 598.6 | 633.8 | 1,002.0 | 700.4 | 615.3 | 711.1 | 746.0 | |||
| 1990's | 784.1 | 786.5 | 1,003.1 | 838.8 | 989.5 | 1,080.0 | 1,300.6 | 1,206.8 | 962.5 | 1,105.3 |
| 2000's | 1,029.0 | 1,013.6 | 1,026.3 | 967.9 | 1,170.5 | 959.9 | 867.2 | 870.7 | 1,096.4 | 1,138.6 |
| 2010's | 793.6 | 834.8 | 695.5 | 982.5 | 1,027.9 | 771.6 | 809.1 | 972.8 | 1,064.0 | 1,157.7 |
| 2020's | 888.8 |
| - = No Data Reported; -- = Not Applicable; NA = Not Available; W = Withheld to avoid disclosure of individual company data. |
| Release Date: 6/1/2022 |
| Next Release Date: TBD |