|
Download Data (XLS File) |
|
||||||||
|
||||||||
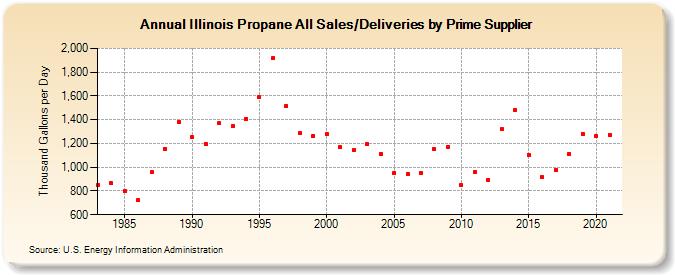
| Illinois Propane All Sales/Deliveries by Prime Supplier (Thousand Gallons per Day) | ||||||||
| Decade | Year-0 | Year-1 | Year-2 | Year-3 | Year-4 | Year-5 | Year-6 | Year-7 | Year-8 | Year-9 |
|---|---|---|---|---|---|---|---|---|---|---|
| 1980's | 852.8 | 863.6 | 801.6 | 722.9 | 956.2 | 1,156.5 | 1,378.9 | |||
| 1990's | 1,251.7 | 1,199.3 | 1,369.4 | 1,346.5 | 1,405.9 | 1,588.3 | 1,918.0 | 1,516.8 | 1,284.6 | 1,263.9 |
| 2000's | 1,280.8 | 1,168.8 | 1,145.5 | 1,192.8 | 1,112.6 | 952.5 | 942.2 | 952.8 | 1,153.1 | 1,171.3 |
| 2010's | 849.3 | 962.8 | 892.4 | 1,320.1 | 1,478.5 | 1,105.6 | 919.4 | 976.2 | 1,111.4 | 1,281.5 |
| 2020's | 1,262.5 |
| - = No Data Reported; -- = Not Applicable; NA = Not Available; W = Withheld to avoid disclosure of individual company data. |
| Release Date: 6/1/2022 |
| Next Release Date: TBD |