|
Download Data (XLS File) |
|
||||||||
|
||||||||
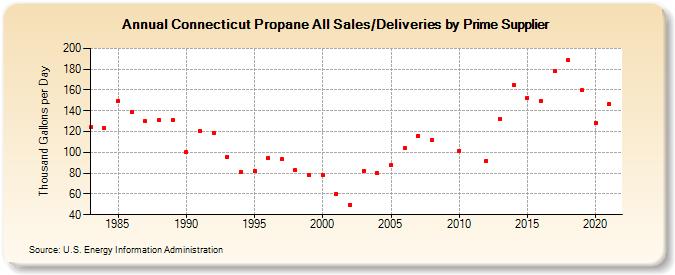
| Connecticut Propane All Sales/Deliveries by Prime Supplier (Thousand Gallons per Day) | ||||||||
| Decade | Year-0 | Year-1 | Year-2 | Year-3 | Year-4 | Year-5 | Year-6 | Year-7 | Year-8 | Year-9 |
|---|---|---|---|---|---|---|---|---|---|---|
| 1980's | 124.0 | 123.0 | 149.7 | 139.1 | 129.7 | 131.3 | 131.2 | |||
| 1990's | 100.1 | 120.7 | 118.9 | 95.9 | 81.1 | 82.0 | 94.9 | 93.3 | 82.9 | 78.2 |
| 2000's | 78.3 | 59.8 | 49.6 | 82.4 | 79.7 | 87.7 | 103.7 | 116.0 | 112.3 | W |
| 2010's | 101.6 | W | 92.1 | 132.5 | 164.7 | 152.3 | 149.4 | 178.3 | 188.4 | 159.7 |
| 2020's | 128.3 |
| - = No Data Reported; -- = Not Applicable; NA = Not Available; W = Withheld to avoid disclosure of individual company data. |
| Release Date: 6/1/2022 |
| Next Release Date: TBD |