|
Download Data (XLS File) |
|
||||||||
|
||||||||
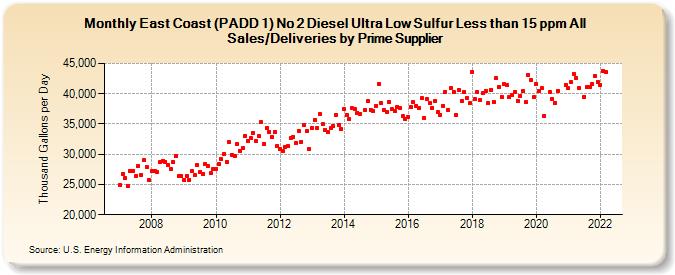
| East Coast (PADD 1) No 2 Diesel Ultra Low Sulfur Less than 15 ppm All Sales/Deliveries by Prime Supplier (Thousand Gallons per Day) | ||||||||
| Year | Jan | Feb | Mar | Apr | May | Jun | Jul | Aug | Sep | Oct | Nov | Dec |
|---|---|---|---|---|---|---|---|---|---|---|---|---|
| 2007 | 24,959.6 | 26,749.7 | 26,089.3 | 24,797.9 | 27,271.9 | 27,241.4 | 26,382.3 | 28,017.2 | 26,633.7 | 28,970.6 | 27,908.5 | 25,740.6 |
| 2008 | 27,190.9 | 27,152.7 | 27,016.1 | 28,694.9 | 28,858.2 | 28,768.5 | 28,137.2 | 27,560.2 | 28,717.5 | 29,631.1 | 26,385.2 | 26,357.6 |
| 2009 | 25,773.9 | 26,436.1 | 25,799.0 | 27,166.7 | 26,604.0 | 28,220.7 | 27,140.5 | 26,798.9 | 28,352.2 | 28,081.5 | 26,814.4 | 27,492.2 |
| 2010 | 27,635.8 | 28,460.4 | 29,139.8 | 30,064.2 | 28,718.9 | 31,959.7 | 29,900.0 | 29,706.9 | 31,723.2 | 30,569.8 | 31,023.0 | 33,090.7 |
| 2011 | 32,253.1 | 32,704.3 | 33,565.5 | 32,262.3 | 32,971.2 | 35,246.7 | 31,765.4 | 34,354.6 | 33,647.8 | 32,818.5 | 33,676.5 | 31,364.7 |
| 2012 | 30,845.1 | 30,532.1 | 31,250.2 | 31,364.5 | 32,696.6 | 32,849.4 | 31,889.6 | 33,893.0 | 32,065.3 | 34,806.6 | 33,787.5 | 30,831.7 |
| 2013 | 34,293.6 | 35,717.3 | 34,315.9 | 36,632.4 | 34,927.2 | 34,001.6 | 33,607.2 | 34,313.3 | 34,656.4 | 36,503.5 | 34,896.8 | 34,176.6 |
| 2014 | 37,396.3 | 36,517.6 | 35,774.5 | 37,612.2 | 37,455.8 | 36,869.2 | 36,683.0 | W | 37,248.7 | 38,737.4 | 37,355.8 | 37,134.6 |
| 2015 | 37,940.1 | 41,642.9 | 38,424.8 | 37,323.3 | 37,048.3 | 38,615.7 | 37,425.5 | 37,069.5 | 37,796.2 | 37,568.5 | 36,250.0 | 35,835.7 |
| 2016 | 36,143.1 | 37,777.2 | 38,589.4 | 38,024.7 | 37,709.4 | 39,216.5 | 36,052.8 | 39,114.8 | 38,442.4 | 37,719.1 | 38,804.4 | 36,918.9 |
| 2017 | 36,538.4 | 37,991.5 | 40,336.4 | 37,294.1 | 40,880.7 | 40,308.9 | 36,480.9 | 40,656.4 | 38,812.0 | 40,305.3 | 39,311.4 | 38,435.1 |
| 2018 | 43,622.1 | 39,114.0 | 40,267.5 | 39,010.3 | 40,116.7 | 40,469.0 | 38,437.0 | 40,661.9 | 38,653.6 | 42,519.1 | 41,137.4 | 39,531.0 |
| 2019 | 41,575.8 | 41,426.6 | 39,403.0 | 39,808.8 | 40,257.5 | 38,812.3 | 39,629.5 | 40,414.6 | 38,561.6 | 43,100.7 | 42,289.1 | 39,401.6 |
| 2020 | 41,685.3 | 40,467.4 | 40,869.5 | 36,390.6 | W | 40,234.7 | 39,147.5 | 38,546.4 | 40,472.9 | W | W | 41,517.3 |
| 2021 | 40,905.0 | 41,907.7 | 43,317.0 | 42,620.5 | 40,886.6 | W | 39,533.6 | 41,100.5 | 41,163.3 | 41,584.7 | 42,921.7 | 41,983.3 |
| 2022 | 41,427.1 | 43,784.2 | 43,557.7 | |||||||||
| - = No Data Reported; -- = Not Applicable; NA = Not Available; W = Withheld to avoid disclosure of individual company data. |
| Release Date: 5/19/2022 |
| Next Release Date: TBD |