|
Download Data (XLS File) |
|
||||||||
|
||||||||
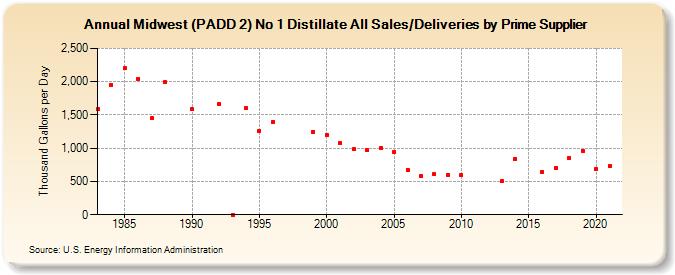
| Midwest (PADD 2) No 1 Distillate All Sales/Deliveries by Prime Supplier (Thousand Gallons per Day) | ||||||||
| Decade | Year-0 | Year-1 | Year-2 | Year-3 | Year-4 | Year-5 | Year-6 | Year-7 | Year-8 | Year-9 |
|---|---|---|---|---|---|---|---|---|---|---|
| 1980's | 1,588.6 | 1,955.9 | 2,200.6 | 2,043.8 | 1,451.9 | 1,994.3 | W | |||
| 1990's | 1,585.5 | W | 1,661.2 | 0.0 | 1,597.5 | 1,260.0 | 1,394.6 | W | W | 1,248.9 |
| 2000's | 1,202.3 | 1,073.2 | 983.8 | 972.1 | 1,005.9 | 949.7 | 678.7 | 581.6 | 604.5 | 598.0 |
| 2010's | 593.8 | W | W | 500.0 | 843.2 | W | 646.8 | 706.0 | 856.0 | 960.2 |
| 2020's | 686.5 |
| - = No Data Reported; -- = Not Applicable; NA = Not Available; W = Withheld to avoid disclosure of individual company data. |
| Release Date: 6/1/2022 |
| Next Release Date: TBD |