|
Download Data (XLS File) |
|
||||||||
|
||||||||
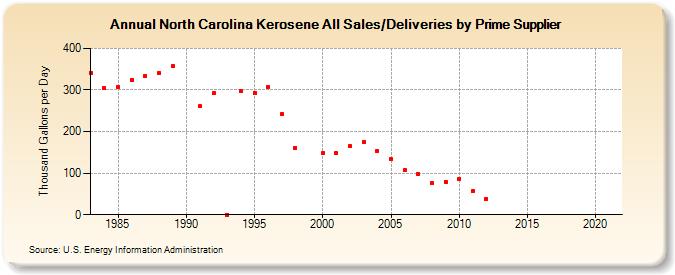
| North Carolina Kerosene All Sales/Deliveries by Prime Supplier (Thousand Gallons per Day) | ||||||||
| Decade | Year-0 | Year-1 | Year-2 | Year-3 | Year-4 | Year-5 | Year-6 | Year-7 | Year-8 | Year-9 |
|---|---|---|---|---|---|---|---|---|---|---|
| 1980's | 341.8 | 303.8 | 307.9 | 324.6 | 333.0 | 341.1 | 356.6 | |||
| 1990's | W | 260.7 | 293.3 | 0.0 | 296.7 | 293.3 | 306.7 | 241.9 | 161.4 | W |
| 2000's | 147.4 | 147.6 | 164.5 | 175.9 | 153.7 | 133.8 | 106.9 | 98.8 | 75.4 | 79.8 |
| 2010's | 87.0 | 56.8 | 38.0 | W | W | W | W | W | W | W |
| 2020's | W |
| - = No Data Reported; -- = Not Applicable; NA = Not Available; W = Withheld to avoid disclosure of individual company data. |
| Release Date: 6/1/2022 |
| Next Release Date: TBD |