|
Download Data (XLS File) |
|
||||||||
|
||||||||
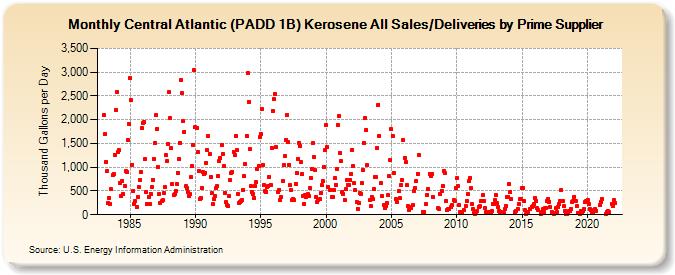
| Central Atlantic (PADD 1B) Kerosene All Sales/Deliveries by Prime Supplier (Thousand Gallons per Day) | ||||||||
| Year | Jan | Feb | Mar | Apr | May | Jun | Jul | Aug | Sep | Oct | Nov | Dec |
|---|---|---|---|---|---|---|---|---|---|---|---|---|
| 1983 | 2,095.9 | 1,697.7 | 1,118.0 | 916.7 | 250.4 | 346.5 | 229.3 | 531.9 | 829.6 | 861.1 | 1,262.5 | 2,201.4 |
| 1984 | 2,588.3 | 1,310.3 | 1,354.2 | 673.6 | 390.4 | 715.3 | 436.3 | 610.8 | 917.2 | 891.5 | 1,566.1 | 1,910.3 |
| 1985 | 2,875.1 | 2,411.9 | 1,053.8 | 503.8 | 221.5 | 282.6 | 167.3 | 382.0 | 584.9 | 739.8 | 894.1 | 1,828.6 |
| 1986 | 1,930.5 | 1,956.3 | 1,176.4 | 476.9 | 220.1 | 371.8 | 224.3 | 442.0 | 586.8 | 736.3 | 1,181.9 | 1,513.6 |
| 1987 | 2,092.7 | 1,804.0 | 1,002.2 | 445.8 | 251.8 | 282.8 | 302.8 | 456.2 | 583.7 | 1,255.3 | 1,130.4 | 1,477.8 |
| 1988 | 2,580.4 | 2,024.7 | 1,394.7 | 645.3 | 415.4 | 442.3 | 495.7 | 646.1 | 885.2 | 1,170.7 | 1,511.4 | 2,834.0 |
| 1989 | 2,552.0 | 1,971.6 | 1,748.1 | 597.4 | 565.4 | 486.9 | 398.8 | 434.3 | 791.2 | 1,018.6 | 1,473.5 | 3,042.0 |
| 1990 | 1,840.8 | 1,830.8 | 1,311.6 | 918.2 | 330.1 | 351.9 | 570.7 | 902.6 | 852.4 | 881.5 | 1,095.1 | 1,357.5 |
| 1991 | 1,652.1 | 1,277.8 | 797.4 | 449.4 | 229.7 | 326.7 | 392.7 | 555.9 | 598.5 | 810.7 | 1,133.3 | 1,184.4 |
| 1992 | 1,472.0 | 1,287.8 | 1,020.5 | 458.5 | 258.6 | 207.5 | 191.6 | 391.5 | 724.6 | 875.6 | 900.1 | 1,327.4 |
| 1993 | 1,264.5 | 1,660.7 | 1,365.3 | 443.9 | 240.7 | 264.3 | 292.1 | 316.3 | 522.3 | 806.1 | 1,070.2 | 1,665.4 |
| 1994 | 2,975.3 | 2,379.9 | 1,375.1 | 594.0 | 476.8 | 445.0 | 351.9 | 602.2 | 683.9 | 953.2 | 1,020.7 | 1,626.7 |
| 1995 | 1,693.6 | 2,227.5 | 1,052.4 | 619.0 | 497.8 | 475.5 | 586.5 | 605.1 | 790.7 | 633.4 | 1,412.9 | 2,189.6 |
| 1996 | 2,432.5 | 2,547.1 | 1,427.6 | W | 468.5 | 526.1 | 317.7 | 363.2 | 710.3 | 1,040.1 | 1,228.9 | 1,569.0 |
| 1997 | 2,103.2 | 1,523.2 | 1,055.0 | 617.3 | 523.3 | 310.8 | 337.5 | 307.5 | 652.0 | 881.4 | 1,180.3 | 1,517.4 |
| 1998 | 1,451.5 | 1,099.2 | 852.8 | 392.2 | 234.7 | 412.7 | 364.2 | 425.6 | 404.1 | 565.9 | 774.9 | 956.3 |
| 1999 | 1,506.5 | 1,219.4 | 933.2 | 375.3 | 266.5 | 312.4 | 321.7 | 449.8 | 624.4 | 706.1 | 1,009.5 | 1,351.6 |
| 2000 | 1,887.9 | 1,423.1 | 578.9 | W | 526.8 | 376.6 | 365.2 | 517.9 | 772.1 | 634.6 | 961.8 | 1,885.1 |
| 2001 | 2,086.5 | 1,307.9 | 1,124.9 | 477.7 | 436.5 | 309.9 | 535.2 | 724.0 | 635.2 | 629.3 | 731.4 | 866.5 |
| 2002 | 1,367.7 | 1,027.2 | 664.9 | 516.8 | 267.0 | 127.1 | 244.5 | 449.8 | 436.8 | 665.6 | 940.3 | 1,505.6 |
| 2003 | 2,034.1 | 1,784.4 | 1,038.9 | W | 302.8 | 177.5 | 372.7 | 330.1 | 537.0 | 799.4 | 794.5 | 1,398.6 |
| 2004 | 2,315.9 | 1,665.1 | 664.2 | 389.7 | W | 203.1 | 146.2 | 190.5 | 253.0 | 408.6 | 809.4 | 1,141.5 |
| 2005 | 1,797.0 | 1,665.0 | 881.1 | W | 330.2 | 259.7 | W | 491.7 | 346.0 | 621.1 | 727.2 | 1,572.8 |
| 2006 | 1,194.9 | 1,113.2 | 621.7 | 175.5 | 101.5 | 165.4 | 137.4 | W | 194.5 | 504.7 | 565.7 | 702.8 |
| 2007 | 865.7 | 1,262.6 | W | W | W | 55.4 | 63.3 | W | 218.7 | 425.2 | 535.0 | 860.5 |
| 2008 | 812.2 | 863.2 | 372.8 | W | W | W | W | 137.2 | 125.3 | 433.1 | 506.1 | 601.5 |
| 2009 | 921.0 | 870.3 | 288.1 | 92.7 | 112.5 | 125.4 | W | 168.1 | 195.9 | 299.8 | 294.1 | 554.5 |
| 2010 | 764.6 | 598.3 | 210.9 | 58.6 | 65.5 | 36.1 | W | 92.2 | 181.7 | 288.8 | 432.9 | 700.8 |
| 2011 | 782.8 | 553.0 | 227.1 | 115.5 | 41.1 | 24.4 | 67.5 | 77.8 | 170.8 | 176.3 | 279.9 | 283.1 |
| 2012 | 404.6 | 296.4 | 138.8 | 47.6 | 54.9 | 30.3 | 66.2 | 58.6 | 76.2 | 226.7 | 222.6 | 313.1 |
| 2013 | 415.4 | 240.8 | 170.6 | 83.4 | 35.6 | 53.1 | W | 35.4 | 116.9 | 189.8 | 380.8 | 380.8 |
| 2014 | 641.5 | 469.3 | 323.4 | W | W | 52.3 | 70.9 | W | 127.9 | 229.3 | 321.3 | 326.3 |
| 2015 | 558.7 | 563.6 | 282.1 | 91.6 | 14.3 | 63.7 | W | 118.0 | W | 170.5 | 182.3 | 222.0 |
| 2016 | 359.0 | 286.6 | 133.9 | 92.0 | W | 24.8 | 50.6 | 111.1 | 48.8 | 132.4 | 148.9 | 296.8 |
| 2017 | 339.6 | 277.5 | 165.9 | 65.0 | 27.9 | 19.8 | 34.1 | 132.9 | 54.3 | 172.6 | 215.7 | 290.2 |
| 2018 | 520.4 | 279.3 | 177.7 | 80.4 | 17.4 | 18.6 | 47.2 | 74.6 | 70.0 | 129.3 | 265.6 | 283.8 |
| 2019 | 379.8 | 289.5 | 178.7 | 42.4 | W | 21.0 | 87.1 | 57.3 | 82.1 | 118.7 | 268.3 | 278.8 |
| 2020 | 311.6 | 233.8 | 128.5 | 96.0 | 45.6 | 33.3 | W | 118.7 | 88.1 | W | W | 203.9 |
| 2021 | 276.2 | 335.5 | W | W | W | 23.4 | 51.7 | 69.5 | 47.7 | W | 226.9 | 185.2 |
| 2022 | 299.9 | 250.8 | W | |||||||||
| - = No Data Reported; -- = Not Applicable; NA = Not Available; W = Withheld to avoid disclosure of individual company data. |
| Release Date: 5/19/2022 |
| Next Release Date: TBD |