|
Download Data (XLS File) |
|
||||||||
|
||||||||
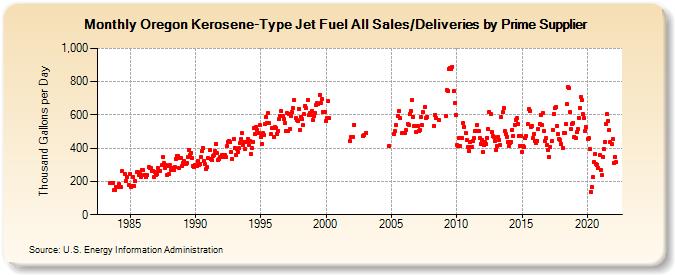
| Oregon Kerosene-Type Jet Fuel All Sales/Deliveries by Prime Supplier (Thousand Gallons per Day) | ||||||||
| Year | Jan | Feb | Mar | Apr | May | Jun | Jul | Aug | Sep | Oct | Nov | Dec |
|---|---|---|---|---|---|---|---|---|---|---|---|---|
| 1983 | W | W | W | W | W | W | 188.8 | W | 191.3 | 146.8 | 148.7 | 167.6 |
| 1984 | W | 165.8 | 184.6 | 167.9 | 163.7 | 261.1 | W | 246.5 | 204.4 | 229.5 | W | 178.8 |
| 1985 | 243.4 | 167.2 | 171.3 | 225.7 | 173.8 | 200.2 | 255.8 | 256.0 | 236.6 | 242.4 | 226.6 | 270.6 |
| 1986 | 267.3 | 238.3 | 241.6 | 227.7 | 236.2 | 285.7 | 282.8 | 283.1 | 260.5 | 262.8 | 224.3 | 259.8 |
| 1987 | 238.7 | 242.1 | 279.7 | 260.9 | 265.4 | 296.0 | 346.8 | 310.9 | 283.2 | 298.5 | 239.0 | 291.5 |
| 1988 | 243.1 | 296.6 | 267.8 | 280.3 | 268.2 | 289.3 | 337.0 | 355.8 | 355.8 | 280.5 | 342.7 | 341.9 |
| 1989 | 292.8 | 309.5 | 321.0 | 307.5 | 313.3 | 348.2 | 386.2 | 359.2 | 372.3 | 341.9 | 293.3 | 287.9 |
| 1990 | 297.6 | 294.6 | 321.3 | 301.7 | 303.7 | 348.2 | 381.9 | 398.9 | 321.7 | 303.1 | 272.9 | 285.8 |
| 1991 | 338.8 | 387.6 | 332.5 | 331.8 | 350.8 | 356.1 | 380.2 | 424.9 | 369.5 | 331.1 | 335.3 | 347.4 |
| 1992 | 359.3 | 348.1 | 360.5 | 359.9 | 345.2 | 411.5 | 438.2 | 445.9 | 434.4 | 376.3 | 334.4 | 456.3 |
| 1993 | 401.7 | 361.4 | 396.8 | 377.2 | 398.7 | 432.4 | 456.5 | 489.7 | 421.2 | 435.4 | 395.3 | 437.9 |
| 1994 | 455.9 | 421.7 | 441.2 | 364.2 | 398.6 | 439.0 | 522.1 | 482.5 | 529.7 | 508.4 | 489.8 | 539.6 |
| 1995 | 464.6 | 423.8 | 489.1 | 479.9 | 544.6 | 585.2 | 551.6 | 609.7 | 549.5 | 483.1 | 519.5 | 519.8 |
| 1996 | 466.7 | 526.5 | 523.7 | 483.8 | 505.5 | 574.2 | 595.5 | 622.5 | 594.1 | 575.8 | 550.4 | 501.0 |
| 1997 | 611.5 | 505.5 | 605.1 | 517.0 | 593.6 | 615.0 | 639.5 | 687.7 | 580.1 | 566.6 | 563.9 | 638.3 |
| 1998 | 510.0 | 589.9 | 574.6 | 538.3 | 603.6 | 656.4 | 642.9 | 692.3 | 597.5 | 609.3 | 598.1 | 623.7 |
| 1999 | 569.0 | 594.5 | 613.2 | 658.1 | 669.8 | 663.4 | 722.2 | 672.5 | 694.5 | 620.3 | 616.6 | 618.2 |
| 2000 | 566.1 | 583.3 | 683.8 | 579.7 | W | W | W | W | W | W | W | W |
| 2001 | W | W | W | W | W | W | W | W | W | W | 441.3 | 469.2 |
| 2002 | W | 469.1 | 542.4 | W | W | W | W | W | W | W | 470.7 | 477.1 |
| 2003 | W | 493.8 | W | W | W | W | W | W | W | W | W | W |
| 2004 | W | W | W | W | W | W | W | W | NA | NA | 414.3 | W |
| 2005 | W | W | 484.0 | 500.8 | 538.3 | W | 591.7 | 626.0 | 579.4 | W | 491.5 | W |
| 2006 | 493.9 | 506.6 | W | 545.2 | 540.8 | 605.8 | 625.1 | 690.7 | 589.9 | 531.1 | 533.2 | 497.2 |
| 2007 | 533.4 | 505.1 | 510.6 | 584.6 | 538.5 | 617.4 | W | 648.1 | 582.8 | 589.1 | W | W |
| 2008 | W | W | W | 535.8 | 599.7 | 582.7 | W | W | 570.5 | W | W | W |
| 2009 | W | W | 594.1 | 748.3 | 744.9 | 873.6 | 882.3 | 875.5 | 890.1 | 741.9 | 671.8 | 602.5 |
| 2010 | 418.7 | 414.8 | 461.9 | 411.6 | 462.8 | 461.8 | 551.0 | 529.2 | 492.5 | 448.1 | 405.6 | 382.0 |
| 2011 | 435.6 | 408.7 | 408.1 | 440.2 | 459.9 | 502.0 | 503.6 | 539.9 | 503.3 | 461.0 | 427.2 | 449.3 |
| 2012 | 376.3 | 417.9 | 435.0 | 423.9 | 463.2 | 514.2 | 618.2 | 604.8 | 500.3 | 475.1 | 465.9 | 444.4 |
| 2013 | 389.5 | 414.6 | 468.5 | 448.4 | 419.5 | 585.4 | 617.5 | 640.3 | 501.9 | 484.8 | 469.8 | 437.5 |
| 2014 | 412.5 | 430.5 | 438.5 | 509.9 | 473.8 | 540.3 | 570.6 | 581.1 | 547.5 | 473.9 | 414.0 | 472.0 |
| 2015 | 377.6 | 411.4 | 408.6 | 459.3 | 476.1 | 542.8 | 636.5 | 623.5 | 527.4 | 534.0 | 460.2 | 487.7 |
| 2016 | 441.2 | 431.3 | 445.9 | 515.4 | 543.0 | 602.2 | 539.3 | 612.6 | 504.4 | 440.5 | 458.6 | 421.2 |
| 2017 | 386.9 | 349.8 | 405.8 | 442.4 | 509.6 | 608.4 | 640.0 | 646.0 | 532.6 | 487.3 | 456.6 | 447.7 |
| 2018 | 424.2 | 403.3 | 491.9 | 490.0 | 544.0 | 663.6 | 768.5 | 760.4 | 616.3 | 512.4 | 547.6 | 552.5 |
| 2019 | 469.5 | 459.3 | 495.2 | 512.6 | 583.8 | 644.3 | 708.8 | 688.1 | 603.0 | 580.9 | 502.5 | 527.9 |
| 2020 | 454.4 | 458.4 | 393.9 | 138.9 | 167.2 | 226.5 | 315.5 | 366.0 | 305.2 | 301.9 | 280.5 | 356.2 |
| 2021 | 270.3 | 237.9 | 349.3 | 395.5 | 439.7 | 546.5 | 603.5 | 564.3 | 506.7 | 438.3 | 424.5 | 452.8 |
| 2022 | 313.9 | 345.0 | 315.8 | |||||||||
| - = No Data Reported; -- = Not Applicable; NA = Not Available; W = Withheld to avoid disclosure of individual company data. |
| Release Date: 5/19/2022 |
| Next Release Date: TBD |