|
Download Data (XLS File) |
|
||||||||
|
||||||||
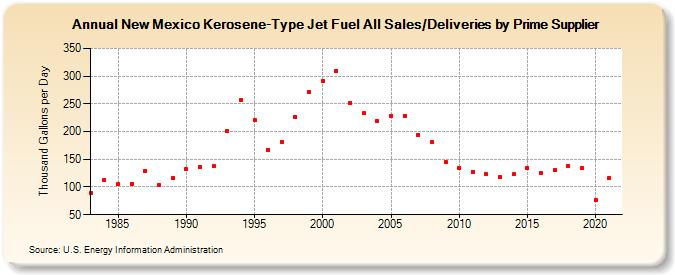
| New Mexico Kerosene-Type Jet Fuel All Sales/Deliveries by Prime Supplier (Thousand Gallons per Day) | ||||||||
| Decade | Year-0 | Year-1 | Year-2 | Year-3 | Year-4 | Year-5 | Year-6 | Year-7 | Year-8 | Year-9 |
|---|---|---|---|---|---|---|---|---|---|---|
| 1980's | 89.9 | 112.5 | 104.9 | 106.0 | 129.7 | 103.3 | 116.0 | |||
| 1990's | 131.9 | 135.8 | 137.0 | 200.5 | 257.0 | 220.2 | 166.5 | 181.8 | 226.0 | 272.0 |
| 2000's | 291.7 | 309.6 | 252.4 | 232.8 | 218.3 | 228.8 | 228.4 | 193.4 | 181.8 | 145.9 |
| 2010's | 134.8 | 127.6 | 122.8 | 117.7 | 122.6 | 134.2 | 125.6 | 129.9 | 137.5 | 134.3 |
| 2020's | 77.0 |
| - = No Data Reported; -- = Not Applicable; NA = Not Available; W = Withheld to avoid disclosure of individual company data. |
| Release Date: 6/1/2022 |
| Next Release Date: TBD |