|
Download Data (XLS File) |
|
||||||||
|
||||||||
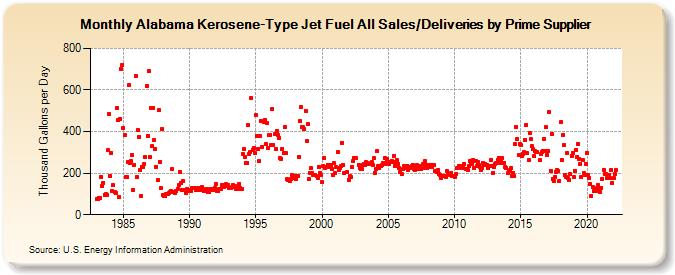
| Alabama Kerosene-Type Jet Fuel All Sales/Deliveries by Prime Supplier (Thousand Gallons per Day) | ||||||||
| Year | Jan | Feb | Mar | Apr | May | Jun | Jul | Aug | Sep | Oct | Nov | Dec |
|---|---|---|---|---|---|---|---|---|---|---|---|---|
| 1983 | 75.8 | 77.7 | 80.2 | 82.0 | 183.2 | 137.3 | 154.0 | 96.2 | 97.3 | 97.2 | 311.1 | 483.5 |
| 1984 | 186.8 | 297.0 | 115.5 | 140.8 | 107.4 | 106.5 | 514.4 | 456.4 | 85.2 | 461.6 | 700.7 | 722.1 |
| 1985 | 416.5 | 384.3 | 181.8 | 181.4 | 253.2 | 622.6 | 250.2 | 257.1 | 286.1 | 120.5 | 239.3 | 666.0 |
| 1986 | 181.3 | 406.7 | 375.9 | 213.0 | 90.5 | 230.5 | 231.8 | 242.9 | 277.4 | 619.1 | 379.1 | 689.6 |
| 1987 | 278.7 | 514.4 | 330.3 | 515.3 | 357.1 | 317.8 | 230.7 | 165.7 | 502.6 | 254.8 | 127.5 | 412.0 |
| 1988 | 94.7 | 90.4 | 89.0 | 99.0 | 97.8 | 105.7 | 108.8 | 115.4 | 217.6 | 111.4 | 111.0 | 106.7 |
| 1989 | 113.7 | 125.4 | 142.8 | 204.8 | 154.3 | 118.4 | 160.0 | 116.5 | 118.4 | 105.4 | 123.4 | 112.4 |
| 1990 | 119.3 | 115.4 | 126.5 | 128.0 | 128.6 | 129.6 | 118.3 | 130.4 | 118.7 | 127.1 | 120.4 | 132.9 |
| 1991 | 124.6 | 114.6 | 113.8 | 119.5 | 124.7 | 109.4 | 111.5 | 125.2 | 120.3 | 119.0 | 122.0 | 129.6 |
| 1992 | 146.8 | 112.3 | 115.5 | 121.4 | 123.0 | 142.4 | 132.2 | 134.3 | 144.8 | 145.9 | 139.6 | 145.0 |
| 1993 | 130.1 | 129.6 | 131.0 | 142.7 | 132.5 | 139.0 | 123.5 | 127.8 | 121.3 | 147.8 | 129.4 | 124.6 |
| 1994 | 294.1 | 314.8 | 278.2 | 248.1 | 249.3 | 430.0 | 291.0 | 299.6 | 562.3 | 312.6 | 319.7 | 296.5 |
| 1995 | 477.6 | 379.8 | 315.1 | 257.9 | 378.3 | 451.4 | 325.7 | 444.3 | 457.8 | 340.1 | 440.6 | 321.0 |
| 1996 | 381.5 | 385.6 | 333.5 | 509.7 | 336.5 | 389.2 | 316.8 | 401.5 | 383.2 | 369.6 | 272.3 | 270.3 |
| 1997 | 316.9 | 298.8 | 420.0 | 296.7 | 170.0 | 165.3 | 165.4 | 161.5 | 172.3 | 190.2 | 176.2 | 184.2 |
| 1998 | 170.2 | 185.4 | 184.7 | 279.9 | 450.6 | 520.2 | 421.4 | 420.3 | 411.6 | 500.5 | 354.8 | 436.4 |
| 1999 | 171.0 | 200.0 | 222.3 | 201.9 | 190.9 | 192.7 | 188.8 | 184.4 | 176.6 | 231.8 | 201.9 | 190.2 |
| 2000 | 155.0 | 236.3 | 272.9 | 224.7 | 230.9 | 241.1 | 231.1 | 236.9 | 238.9 | 219.8 | 189.7 | 246.5 |
| 2001 | 200.9 | 227.4 | 302.5 | 214.4 | 226.3 | 232.9 | 346.5 | 241.0 | 201.5 | W | W | 203.7 |
| 2002 | 168.2 | 186.4 | 181.6 | 230.0 | 256.0 | 274.7 | W | 271.5 | W | 241.2 | 225.9 | 218.3 |
| 2003 | 221.4 | 239.0 | 245.5 | 240.3 | 251.2 | 248.4 | 243.1 | 242.1 | 248.7 | 252.3 | 239.0 | 271.2 |
| 2004 | 202.3 | 219.7 | 305.7 | 235.1 | 222.8 | 235.7 | 237.0 | 250.5 | 243.9 | 271.4 | 248.6 | 268.1 |
| 2005 | 244.6 | 241.7 | 252.5 | 259.9 | 255.6 | 284.1 | 235.3 | 252.0 | 261.6 | 246.3 | 226.5 | 207.3 |
| 2006 | 193.8 | 218.6 | 232.4 | 225.7 | 224.7 | 235.1 | 216.0 | 228.1 | 226.3 | 233.1 | 240.9 | 219.0 |
| 2007 | 214.3 | 228.8 | 237.5 | 221.7 | 235.1 | 231.1 | 218.6 | 242.2 | 223.6 | 258.3 | 237.1 | 222.8 |
| 2008 | 229.1 | 237.0 | 229.4 | 238.4 | 227.3 | 241.5 | 210.0 | 211.1 | 205.0 | 216.4 | 194.6 | 192.5 |
| 2009 | 176.0 | 186.7 | 184.2 | 185.1 | 182.8 | 208.2 | 195.9 | 196.7 | 192.8 | 201.9 | 187.2 | 184.5 |
| 2010 | 181.4 | 196.5 | 223.4 | 224.9 | 233.4 | 235.3 | 229.6 | 222.9 | 225.9 | 244.9 | 218.8 | 220.5 |
| 2011 | 214.0 | 232.7 | 257.1 | 248.0 | 245.8 | 264.0 | 227.0 | 257.2 | 235.9 | 253.5 | 239.0 | 228.7 |
| 2012 | 214.6 | 223.5 | 248.9 | 240.6 | 242.9 | 239.7 | 226.3 | 235.0 | 232.3 | 262.6 | 235.8 | 202.0 |
| 2013 | 230.5 | 243.4 | 250.9 | 264.3 | 273.2 | 248.0 | 262.9 | 273.6 | 250.6 | 250.8 | 230.8 | 224.7 |
| 2014 | 200.2 | 209.3 | 214.5 | 225.6 | 187.9 | 200.2 | 188.5 | 339.0 | 423.9 | 364.5 | 286.8 | 340.6 |
| 2015 | 333.1 | 282.1 | 294.2 | 301.6 | 360.2 | 431.6 | 295.2 | 263.9 | 393.8 | 363.0 | 328.7 | 314.3 |
| 2016 | 282.0 | 305.2 | 300.9 | 302.4 | NA | 261.8 | 290.0 | 301.8 | 308.3 | 365.4 | 305.2 | 419.9 |
| 2017 | 289.6 | 305.9 | 493.8 | 211.8 | 388.7 | 172.1 | 159.8 | 181.7 | 207.7 | 215.2 | 207.9 | 163.0 |
| 2018 | 444.5 | 261.2 | 383.0 | 334.0 | 190.5 | 183.0 | 294.6 | 176.4 | 168.5 | 194.0 | 282.8 | 297.7 |
| 2019 | 183.5 | 212.0 | 313.6 | 279.6 | 341.7 | 269.1 | 244.8 | 180.4 | 264.0 | 199.0 | 189.3 | 245.7 |
| 2020 | 298.3 | 192.2 | 178.1 | 146.7 | 90.1 | 132.9 | 112.4 | 125.2 | 116.2 | 129.3 | 142.6 | 111.8 |
| 2021 | 108.2 | 129.1 | 173.4 | 215.9 | 194.7 | 195.8 | 178.0 | 188.6 | 192.8 | 176.7 | 215.8 | 154.2 |
| 2022 | 176.0 | 194.0 | 212.8 | |||||||||
| - = No Data Reported; -- = Not Applicable; NA = Not Available; W = Withheld to avoid disclosure of individual company data. |
| Release Date: 5/19/2022 |
| Next Release Date: TBD |