|
Download Data (XLS File) |
|
||||||||
|
||||||||
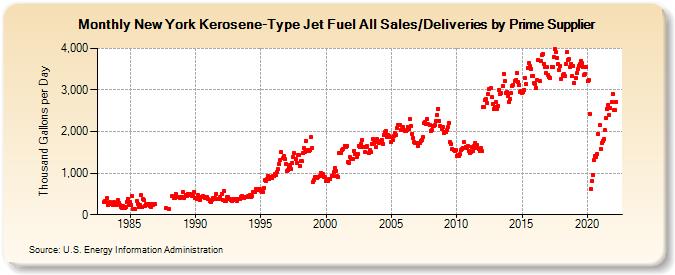
| New York Kerosene-Type Jet Fuel All Sales/Deliveries by Prime Supplier (Thousand Gallons per Day) | ||||||||
| Year | Jan | Feb | Mar | Apr | May | Jun | Jul | Aug | Sep | Oct | Nov | Dec |
|---|---|---|---|---|---|---|---|---|---|---|---|---|
| 1983 | 297.9 | 340.5 | 309.6 | 399.3 | 222.2 | 246.7 | 295.7 | 248.8 | 227.4 | 294.0 | 228.1 | 234.8 |
| 1984 | 282.3 | 346.6 | 288.1 | 237.8 | 196.1 | 169.7 | 209.9 | 165.2 | 182.4 | 307.0 | 385.7 | 223.3 |
| 1985 | 317.0 | 235.9 | 449.8 | 142.7 | 139.2 | 136.4 | 325.9 | 268.7 | 197.4 | 231.2 | 465.8 | 181.9 |
| 1986 | 374.2 | 344.6 | 210.7 | 253.3 | 223.8 | 260.5 | 221.5 | 191.4 | 255.0 | 238.3 | 263.7 | 248.3 |
| 1987 | W | W | W | W | W | W | W | W | W | 160.2 | W | W |
| 1988 | 142.5 | W | W | 445.2 | 411.5 | 400.3 | 509.8 | 419.9 | 421.7 | W | 412.1 | 420.1 |
| 1989 | 435.9 | 541.3 | 402.9 | 474.9 | 461.7 | 509.4 | 468.5 | 501.6 | 482.1 | 461.3 | 444.2 | 544.2 |
| 1990 | 394.3 | 376.9 | 472.2 | 417.7 | 347.7 | 422.2 | 425.8 | 442.8 | 415.1 | 398.8 | 421.5 | 415.0 |
| 1991 | 374.6 | 319.5 | 309.3 | 357.2 | 404.1 | 378.3 | 398.6 | 507.2 | 372.0 | 378.5 | 383.6 | 425.0 |
| 1992 | 495.7 | 363.1 | 569.1 | 322.1 | 320.8 | 428.7 | 414.6 | 389.7 | 372.2 | 360.0 | 327.4 | 388.5 |
| 1993 | 357.7 | 375.5 | 333.6 | 374.3 | 367.9 | 370.9 | 437.3 | 449.7 | 416.6 | 406.5 | 417.9 | 429.9 |
| 1994 | 449.4 | 436.8 | 463.8 | 430.8 | 438.4 | 541.5 | 536.4 | 550.2 | 607.4 | 590.0 | 612.4 | 622.4 |
| 1995 | 562.2 | 542.8 | 550.5 | 643.8 | 823.9 | 818.6 | 862.2 | 939.6 | 860.6 | 911.3 | 881.6 | 922.6 |
| 1996 | 926.6 | 984.5 | 950.7 | 1,018.1 | 1,091.8 | 1,231.0 | 1,309.9 | 1,504.4 | 1,356.6 | 1,410.3 | 1,338.4 | 1,230.7 |
| 1997 | 1,048.2 | 1,080.6 | 1,148.2 | 1,192.6 | 1,097.0 | 1,250.0 | 1,385.6 | 1,481.6 | 1,329.2 | 1,255.5 | 1,426.7 | 1,429.6 |
| 1998 | 1,170.2 | 1,302.4 | 1,284.2 | 1,492.2 | 1,597.1 | 1,510.5 | 1,774.3 | 1,551.1 | 1,521.8 | 1,564.2 | 1,866.5 | 1,616.0 |
| 1999 | 791.0 | 846.7 | 895.3 | 916.5 | 876.7 | 899.2 | 921.0 | 1,010.8 | 972.0 | 975.8 | 915.7 | 907.6 |
| 2000 | 818.6 | 816.2 | 808.8 | 858.1 | 857.0 | 927.9 | 939.1 | 1,022.6 | 1,124.5 | 1,046.4 | 919.4 | 899.0 |
| 2001 | 1,481.9 | 1,487.4 | 1,487.8 | 1,554.7 | 1,587.2 | 1,652.9 | 1,620.0 | 1,663.2 | 1,278.3 | 1,235.1 | 1,378.7 | 1,332.2 |
| 2002 | 1,348.1 | 1,338.1 | 1,532.3 | 1,450.3 | 1,394.8 | 1,471.9 | 1,655.8 | 1,635.1 | 1,706.0 | 1,788.4 | 1,638.5 | 1,638.7 |
| 2003 | 1,508.6 | 1,623.5 | 1,642.9 | 1,493.9 | 1,551.8 | 1,511.4 | 1,702.8 | 1,818.4 | 1,731.6 | 1,749.1 | 1,624.5 | 1,813.5 |
| 2004 | 1,765.8 | 1,735.9 | 1,772.3 | 1,803.3 | 1,708.2 | 1,917.7 | 1,990.2 | 2,007.6 | 1,878.5 | 1,905.7 | 1,883.8 | 1,866.0 |
| 2005 | 1,741.0 | 1,791.4 | 1,891.3 | 1,959.7 | 1,926.8 | 2,073.6 | 2,153.3 | 2,164.6 | 2,155.7 | 2,044.1 | 2,059.1 | 2,103.7 |
| 2006 | 2,023.2 | 2,021.6 | 2,045.7 | 2,114.7 | 2,058.7 | 2,297.4 | 2,139.6 | 1,946.6 | 1,844.8 | 1,745.8 | 1,731.6 | 1,726.5 |
| 2007 | 1,661.8 | 1,713.1 | 1,732.8 | 1,778.8 | 1,803.3 | 1,872.9 | 2,204.4 | 2,240.5 | 2,192.3 | 2,302.3 | 2,173.2 | 2,152.7 |
| 2008 | 2,024.6 | 2,040.7 | 2,123.3 | 2,132.0 | 2,157.3 | 2,258.5 | 2,409.5 | 2,554.0 | 2,255.4 | 2,132.5 | 2,060.2 | 2,112.3 |
| 2009 | 1,966.4 | 1,982.9 | 2,000.6 | 2,029.5 | 2,120.0 | 2,207.0 | 1,738.0 | 1,690.7 | 1,571.9 | 1,556.2 | 1,528.4 | 1,556.8 |
| 2010 | 1,417.4 | 1,435.4 | 1,400.8 | 1,452.5 | 1,551.0 | 1,583.0 | 1,614.6 | 1,744.5 | 1,630.7 | 1,602.8 | 1,655.6 | 1,542.9 |
| 2011 | 1,484.1 | 1,496.3 | 1,619.6 | 1,529.6 | 1,658.7 | 1,735.4 | 1,613.4 | 1,671.9 | 1,585.7 | 1,522.4 | 1,600.3 | 1,532.8 |
| 2012 | 2,593.2 | 2,583.0 | 2,759.2 | 2,781.5 | 2,683.5 | 2,898.8 | 3,032.4 | 3,038.8 | 2,819.2 | 2,672.0 | 2,550.0 | 2,596.3 |
| 2013 | 2,700.1 | 2,553.5 | 2,613.7 | 3,008.8 | 2,896.3 | 2,925.7 | 3,093.5 | 3,394.5 | 3,210.9 | 2,931.6 | 2,961.0 | 2,857.2 |
| 2014 | 2,720.1 | 2,794.4 | 2,922.6 | 3,104.3 | 3,127.0 | 3,208.4 | 3,233.5 | 3,418.8 | 3,203.3 | 3,118.4 | 2,957.0 | 2,966.7 |
| 2015 | 2,937.9 | 2,961.9 | 3,010.6 | 3,288.0 | 3,141.0 | 3,538.1 | 3,636.8 | 3,567.4 | 3,497.2 | 3,334.4 | 3,334.5 | 3,176.4 |
| 2016 | 3,143.1 | 3,035.6 | 3,244.0 | 3,714.7 | 3,207.3 | 3,690.1 | 3,851.7 | 3,865.9 | 3,624.9 | 3,556.0 | 3,405.0 | 3,545.9 |
| 2017 | 3,355.9 | 3,317.3 | 3,299.1 | 3,564.2 | 3,563.5 | 3,796.2 | 3,977.2 | 3,912.9 | 3,777.6 | 3,615.3 | 3,490.7 | 3,576.4 |
| 2018 | 3,275.2 | 3,357.9 | 3,382.3 | 3,337.0 | 3,626.3 | 3,908.4 | 3,724.5 | 3,752.4 | 3,544.0 | 3,624.5 | 3,334.4 | 3,573.9 |
| 2019 | 3,172.5 | 3,298.9 | 3,396.5 | 3,503.0 | 3,584.4 | 3,614.1 | 3,708.1 | 3,642.4 | 3,564.0 | 3,366.7 | 3,385.2 | 3,551.0 |
| 2020 | 3,214.5 | 3,241.4 | 2,432.4 | 626.1 | 811.6 | 962.2 | 1,304.8 | 1,412.6 | 1,380.3 | 1,471.9 | 1,946.6 | 2,156.8 |
| 2021 | 1,578.2 | 1,733.3 | 1,774.1 | 1,809.1 | 2,026.2 | 2,320.0 | 2,548.6 | 2,644.9 | 2,398.9 | 2,563.1 | 2,712.6 | 2,905.1 |
| 2022 | 2,524.1 | 2,523.6 | 2,717.5 | |||||||||
| - = No Data Reported; -- = Not Applicable; NA = Not Available; W = Withheld to avoid disclosure of individual company data. |
| Release Date: 5/19/2022 |
| Next Release Date: TBD |