|
Download Data (XLS File) |
|
||||||||
|
||||||||
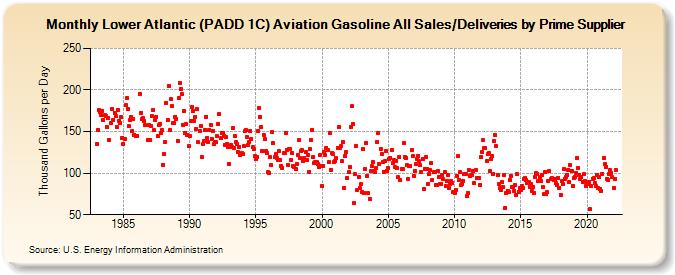
| Lower Atlantic (PADD 1C) Aviation Gasoline All Sales/Deliveries by Prime Supplier (Thousand Gallons per Day) | ||||||||
| Year | Jan | Feb | Mar | Apr | May | Jun | Jul | Aug | Sep | Oct | Nov | Dec |
|---|---|---|---|---|---|---|---|---|---|---|---|---|
| 1983 | 135.1 | 152.4 | 176.1 | 173.2 | 169.9 | 175.2 | 163.6 | 169.8 | 169.0 | 155.8 | 166.8 | 139.9 |
| 1984 | W | 160.6 | 177.0 | 163.9 | 172.8 | 168.3 | 156.0 | 176.0 | 163.0 | 160.3 | 167.7 | 142.8 |
| 1985 | 135.3 | 141.1 | 181.4 | 190.8 | 177.5 | 156.6 | 163.5 | 168.1 | 150.1 | 164.9 | 146.3 | 145.0 |
| 1986 | 145.2 | W | W | 195.5 | 172.7 | 165.0 | 165.8 | 162.7 | 157.3 | W | 139.4 | 158.0 |
| 1987 | 140.4 | 156.1 | 168.4 | 176.1 | 151.8 | 163.3 | 167.6 | 144.6 | 157.7 | 159.5 | 148.0 | 151.5 |
| 1988 | 110.2 | 123.2 | 137.6 | 184.6 | 163.8 | 205.1 | 151.5 | 189.1 | 180.8 | 160.0 | 160.2 | 168.0 |
| 1989 | 164.8 | 138.8 | 190.1 | 208.4 | 201.2 | 194.6 | 158.2 | 175.0 | 148.7 | 158.9 | 146.2 | 132.2 |
| 1990 | 144.6 | 162.8 | 179.4 | 174.9 | 163.0 | 167.7 | 153.5 | 176.6 | 137.1 | 150.5 | 156.9 | 119.2 |
| 1991 | 134.6 | 138.7 | 152.2 | 168.1 | 142.5 | 137.3 | 152.2 | 158.0 | 141.3 | 151.1 | 135.6 | 137.1 |
| 1992 | 137.2 | 144.2 | 159.4 | 171.4 | 141.8 | 148.3 | 148.8 | 144.5 | 134.1 | 143.4 | 135.5 | 131.0 |
| 1993 | 111.3 | 133.6 | 132.0 | 154.3 | 130.5 | 144.1 | 137.6 | 134.6 | 125.7 | 131.5 | 122.1 | 123.9 |
| 1994 | 122.7 | 132.6 | 150.3 | 152.0 | 143.9 | 134.1 | 138.0 | 150.7 | 141.6 | 131.2 | 129.1 | 120.7 |
| 1995 | 117.5 | 119.8 | 150.9 | 177.8 | 168.0 | 155.4 | 126.9 | 146.0 | 141.5 | 126.5 | 124.7 | 101.0 |
| 1996 | 100.7 | 119.2 | 109.9 | 149.2 | 135.9 | 118.8 | 122.7 | 118.6 | 115.9 | 126.3 | 116.0 | 108.4 |
| 1997 | 106.5 | 124.1 | 124.4 | 148.4 | 127.7 | 110.1 | 129.3 | 129.6 | 116.0 | 124.8 | 108.5 | 107.8 |
| 1998 | 104.8 | 111.3 | 121.7 | 139.8 | 117.7 | 127.1 | 127.7 | 114.8 | 118.2 | 125.4 | 116.2 | 121.3 |
| 1999 | 101.5 | 128.9 | 139.6 | 152.3 | 119.1 | 112.2 | 113.5 | 113.3 | 110.8 | 107.3 | 121.5 | 108.6 |
| 2000 | 84.8 | 108.9 | 124.9 | 122.3 | 130.5 | 127.8 | 113.3 | 148.0 | 103.9 | 124.1 | 122.5 | 113.8 |
| 2001 | 114.2 | 117.6 | 130.4 | 155.7 | 130.5 | 132.2 | 114.0 | 137.3 | 82.2 | 121.2 | 125.2 | 94.4 |
| 2002 | 100.8 | 107.5 | 155.9 | 180.4 | 159.5 | 64.0 | 98.6 | 132.7 | 80.0 | 95.6 | 81.8 | 86.5 |
| 2003 | 77.5 | 129.3 | 76.0 | 104.9 | 136.4 | 96.7 | 75.8 | 68.9 | 102.8 | 108.2 | 112.9 | 102.4 |
| 2004 | 100.8 | 106.5 | 137.2 | 148.3 | 110.5 | 128.8 | 123.4 | 113.3 | 101.8 | 114.0 | 126.2 | 102.7 |
| 2005 | 106.0 | 117.5 | 118.5 | 127.9 | 111.9 | 115.7 | 107.5 | 115.0 | 105.6 | 94.9 | 120.0 | 92.1 |
| 2006 | 105.5 | 105.3 | 136.3 | 119.4 | 118.7 | 109.3 | 93.4 | 108.3 | 108.2 | 127.9 | 120.1 | 97.1 |
| 2007 | 102.3 | 111.0 | 117.5 | 121.0 | 114.5 | 109.2 | 101.9 | 117.5 | 80.8 | 105.5 | 119.1 | 105.3 |
| 2008 | 87.1 | 98.7 | 103.5 | 111.8 | 92.3 | 101.1 | 101.2 | 85.6 | 85.9 | 102.2 | 95.3 | 87.4 |
| 2009 | 87.4 | 98.1 | 92.7 | 101.2 | 84.7 | 90.9 | 98.3 | 82.5 | 86.7 | 90.1 | 88.2 | 77.2 |
| 2010 | 76.6 | 80.2 | 96.4 | 120.3 | 91.2 | 101.1 | 86.3 | 86.4 | 90.6 | 98.4 | 99.4 | 72.2 |
| 2011 | 75.9 | 104.0 | 96.0 | 98.0 | 98.2 | 102.4 | 88.0 | 103.6 | 94.0 | 94.4 | 94.4 | 86.2 |
| 2012 | 119.8 | 125.3 | 139.4 | 129.9 | 129.8 | 114.6 | 122.7 | 124.4 | 102.1 | 117.5 | 121.1 | 98.5 |
| 2013 | 138.6 | 145.8 | 132.6 | 97.6 | 87.5 | 81.6 | 79.9 | 88.8 | 83.9 | 98.1 | 58.5 | 75.6 |
| 2014 | 79.0 | 77.8 | 91.3 | 97.1 | 83.3 | 83.8 | 79.0 | 85.3 | 73.9 | 98.5 | 77.8 | 82.5 |
| 2015 | 80.3 | 84.9 | 81.9 | 93.2 | 94.2 | 91.8 | 88.2 | 89.0 | 83.4 | 87.0 | 79.0 | 83.5 |
| 2016 | 76.2 | 95.3 | 99.7 | 99.5 | 90.8 | 94.8 | 90.7 | 97.4 | 83.4 | 74.5 | 101.3 | 75.2 |
| 2017 | 77.1 | 90.3 | 102.7 | 92.4 | 94.4 | 92.4 | 92.2 | 92.5 | 88.1 | 85.8 | 94.7 | 82.2 |
| 2018 | 74.0 | 90.5 | 87.1 | 105.0 | 93.1 | 95.1 | 97.8 | 104.1 | 88.8 | 109.7 | 102.7 | 84.7 |
| 2019 | 94.0 | 95.4 | 100.3 | 118.4 | 106.7 | 97.8 | 93.3 | 94.8 | 89.5 | 98.4 | 90.6 | 84.5 |
| 2020 | 89.6 | 86.4 | 89.8 | 56.3 | 84.0 | 93.5 | 93.7 | 87.9 | 84.0 | 97.9 | 82.0 | 94.9 |
| 2021 | 80.8 | 78.1 | 99.3 | 118.2 | 110.9 | 107.7 | 93.5 | 92.1 | 98.7 | 103.6 | 100.3 | 95.0 |
| 2022 | 82.7 | 92.8 | 104.1 | |||||||||
| - = No Data Reported; -- = Not Applicable; NA = Not Available; W = Withheld to avoid disclosure of individual company data. |
| Release Date: 5/19/2022 |
| Next Release Date: TBD |