|
Download Data (XLS File) |
|
||||||||
|
||||||||
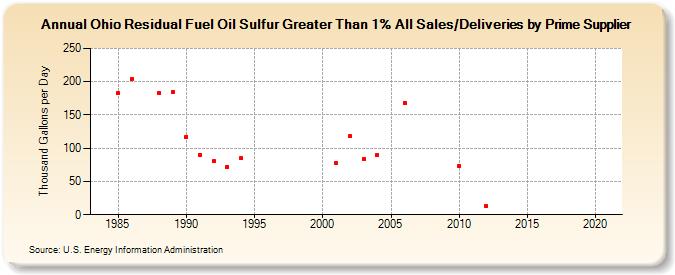
| Ohio Residual Fuel Oil Sulfur Greater Than 1% All Sales/Deliveries by Prime Supplier (Thousand Gallons per Day) | ||||||||
| Decade | Year-0 | Year-1 | Year-2 | Year-3 | Year-4 | Year-5 | Year-6 | Year-7 | Year-8 | Year-9 |
|---|---|---|---|---|---|---|---|---|---|---|
| 1980's | W | W | 182.6 | 203.8 | W | 182.3 | 184.2 | |||
| 1990's | 117.2 | 90.4 | 80.1 | 72.1 | 84.8 | W | W | W | W | W |
| 2000's | W | 77.0 | 118.0 | 83.8 | 90.0 | W | 168.5 | W | W | W |
| 2010's | 73.3 | W | 13.4 | W | W | W | W | - | W | W |
| 2020's | W |
| - = No Data Reported; -- = Not Applicable; NA = Not Available; W = Withheld to avoid disclosure of individual company data. |
| Release Date: 6/1/2022 |
| Next Release Date: TBD |