|
Download Data (XLS File) |
|
||||||||
|
||||||||
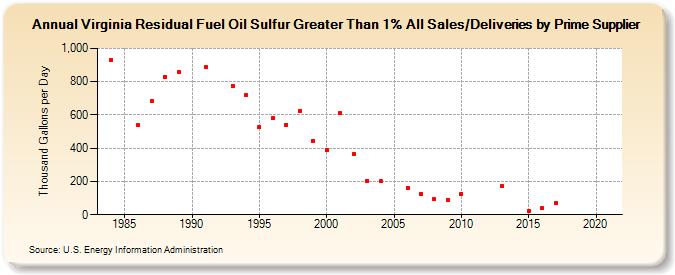
| Virginia Residual Fuel Oil Sulfur Greater Than 1% All Sales/Deliveries by Prime Supplier (Thousand Gallons per Day) | ||||||||
| Decade | Year-0 | Year-1 | Year-2 | Year-3 | Year-4 | Year-5 | Year-6 | Year-7 | Year-8 | Year-9 |
|---|---|---|---|---|---|---|---|---|---|---|
| 1980's | W | 931.2 | W | 537.1 | 682.1 | 829.8 | 856.8 | |||
| 1990's | W | 888.4 | W | 774.1 | 719.5 | 527.1 | 580.3 | 539.5 | 623.6 | 443.4 |
| 2000's | 390.1 | 612.2 | 366.9 | 200.8 | 199.8 | W | 163.6 | 126.3 | 91.7 | 91.1 |
| 2010's | 126.4 | W | W | 175.0 | W | 22.2 | 39.0 | 70.0 | W | W |
| 2020's | W |
| - = No Data Reported; -- = Not Applicable; NA = Not Available; W = Withheld to avoid disclosure of individual company data. |
| Release Date: 6/1/2022 |
| Next Release Date: TBD |