|
Download Data (XLS File) |
|
||||||||
|
||||||||
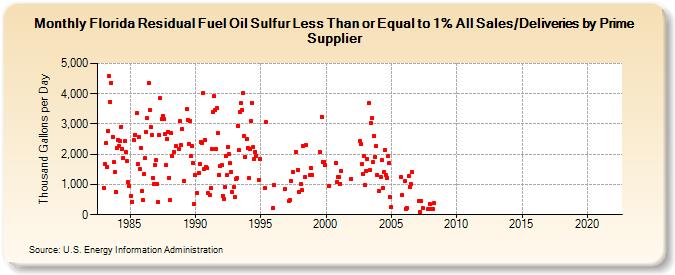
| Florida Residual Fuel Oil Sulfur Less Than or Equal to 1% All Sales/Deliveries by Prime Supplier (Thousand Gallons per Day) | ||||||||
| Year | Jan | Feb | Mar | Apr | May | Jun | Jul | Aug | Sep | Oct | Nov | Dec |
|---|---|---|---|---|---|---|---|---|---|---|---|---|
| 1983 | 885.5 | 1,660.8 | 2,359.1 | 1,575.2 | 2,772.6 | 4,569.8 | 3,741.5 | 4,370.3 | 2,582.5 | 1,734.1 | 1,404.5 | 752.1 |
| 1984 | 2,209.7 | 2,463.7 | 2,265.7 | 2,436.8 | 2,903.7 | 2,188.2 | 1,889.9 | 2,434.6 | 2,057.3 | 1,760.8 | 1,071.3 | 938.7 |
| 1985 | W | 634.6 | 434.8 | W | 2,458.7 | 2,645.0 | 3,360.9 | 1,668.6 | 2,569.1 | 1,510.2 | 2,212.4 | 797.6 |
| 1986 | 484.3 | 1,350.3 | 1,874.3 | 2,737.7 | 3,181.1 | 4,370.7 | 3,465.5 | 2,890.1 | 2,644.3 | 1,229.9 | 1,000.9 | 1,648.4 |
| 1987 | 1,794.1 | 1,017.4 | 416.8 | 2,625.9 | 3,852.1 | 3,157.1 | 3,264.3 | 3,160.6 | 2,656.7 | 1,633.9 | 2,505.0 | 2,745.6 |
| 1988 | 1,222.1 | 484.8 | 2,698.4 | 1,939.4 | 2,071.5 | NA | 2,255.4 | W | W | 2,167.1 | 3,087.4 | 2,292.4 |
| 1989 | 2,827.1 | W | 1,110.6 | W | 3,490.9 | 3,131.8 | 2,325.5 | 3,100.1 | 1,928.9 | 2,258.4 | 1,707.4 | 346.6 |
| 1990 | 1,300.9 | 721.6 | W | 1,372.6 | 1,686.3 | 2,396.7 | 2,373.0 | 4,013.3 | 1,512.1 | 2,471.7 | 1,562.3 | 1,530.1 |
| 1991 | 704.4 | 654.4 | 881.0 | 2,186.5 | 3,396.8 | 3,912.0 | 3,456.8 | 2,184.1 | 3,517.0 | 2,689.8 | 1,318.7 | 1,625.6 |
| 1992 | 1,629.3 | 634.8 | 523.0 | 919.5 | 1,942.8 | 1,307.6 | 2,254.0 | 1,995.5 | 1,696.5 | 1,404.1 | 756.6 | 920.5 |
| 1993 | 579.8 | 1,167.7 | 1,206.8 | 2,943.5 | 2,134.5 | 3,400.4 | 3,692.5 | 3,469.1 | 4,008.2 | 2,588.2 | 1,908.5 | 2,490.1 |
| 1994 | 2,201.0 | 1,203.8 | 2,174.2 | 3,093.6 | 3,706.4 | 2,228.0 | 1,826.5 | 2,088.8 | 1,951.0 | W | 1,160.9 | 1,825.7 |
| 1995 | W | W | W | W | 883.1 | 3,052.7 | W | W | W | W | W | 206.5 |
| 1996 | 987.0 | W | W | W | W | W | W | W | W | W | 835.0 | W |
| 1997 | W | W | 450.2 | 474.7 | 1,116.0 | W | 1,413.9 | W | 2,079.1 | W | 1,480.4 | 760.7 |
| 1998 | W | 1,020.5 | 805.4 | 2,284.0 | W | 1,249.1 | 2,311.5 | W | W | 1,312.8 | 1,553.2 | 1,306.0 |
| 1999 | W | W | W | W | W | W | 2,078.6 | W | 3,240.7 | 1,740.2 | 1,753.5 | 1,630.4 |
| 2000 | W | W | W | 955.6 | W | W | W | W | W | 1,703.2 | 1,083.9 | 1,230.4 |
| 2001 | 1,240.2 | 1,023.4 | 1,437.2 | W | W | W | W | W | W | W | W | 1,191.2 |
| 2002 | W | W | W | W | W | W | W | 2,424.3 | 2,324.9 | 1,661.7 | 1,346.7 | 1,931.7 |
| 2003 | 981.2 | 1,457.9 | 1,846.8 | 3,685.6 | 1,474.3 | 3,016.2 | 3,194.9 | 1,735.9 | 2,616.1 | 1,898.4 | 2,277.7 | 1,317.5 |
| 2004 | W | 767.7 | 1,246.9 | 1,805.5 | 878.5 | 1,403.1 | 2,131.5 | 1,303.6 | 1,229.2 | 1,946.1 | 1,714.9 | 570.5 |
| 2005 | 246.8 | W | W | W | W | W | W | W | W | 1,245.5 | 648.4 | W |
| 2006 | 1,105.5 | 197.5 | 229.3 | W | 1,264.3 | 918.7 | 1,010.6 | 1,399.6 | W | W | W | W |
| 2007 | W | 457.7 | 77.8 | 460.8 | W | 210.9 | W | W | W | W | 204.3 | 357.2 |
| 2008 | 204.6 | W | 204.9 | 373.8 | W | W | W | W | W | W | W | W |
| 2009 | W | W | W | W | W | W | W | W | W | NA | NA | NA |
| 2010 | W | W | - | - | W | W | W | W | W | W | - | W |
| 2011 | W | W | W | - | - | W | - | W | - | - | - | - |
| 2012 | - | - | - | - | - | - | W | W | W | W | W | W |
| 2013 | W | W | W | W | W | W | W | W | W | W | W | W |
| 2014 | W | W | W | W | W | W | W | W | W | W | W | W |
| 2015 | - | W | W | - | - | W | - | - | - | - | - | - |
| 2016 | - | W | W | W | W | W | W | W | W | W | - | - |
| 2017 | - | - | - | - | - | - | - | - | - | W | - | - |
| 2018 | - | - | - | - | - | - | - | - | - | - | - | - |
| 2019 | - | - | - | - | - | - | - | - | - | - | - | - |
| 2020 | - | - | - | - | - | - | - | - | - | - | - | - |
| 2021 | - | - | W | W | - | - | W | W | W | W | W | W |
| 2022 | W | W | W | |||||||||
| - = No Data Reported; -- = Not Applicable; NA = Not Available; W = Withheld to avoid disclosure of individual company data. |
| Release Date: 5/19/2022 |
| Next Release Date: TBD |