|
Download Data (XLS File) |
|
||||||||
|
||||||||
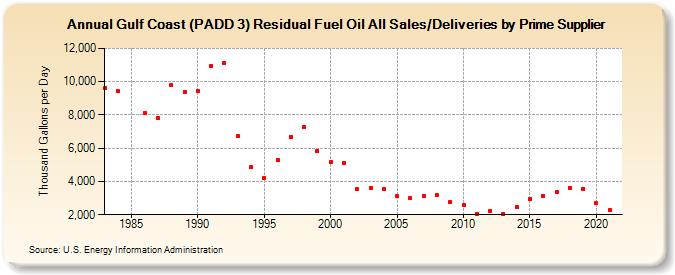
| Gulf Coast (PADD 3) Residual Fuel Oil All Sales/Deliveries by Prime Supplier (Thousand Gallons per Day) | ||||||||
| Decade | Year-0 | Year-1 | Year-2 | Year-3 | Year-4 | Year-5 | Year-6 | Year-7 | Year-8 | Year-9 |
|---|---|---|---|---|---|---|---|---|---|---|
| 1980's | 9,621.9 | 9,424.0 | W | 8,135.0 | 7,814.7 | 9,782.7 | 9,393.6 | |||
| 1990's | 9,443.0 | 10,930.5 | 11,150.8 | 6,713.1 | 4,889.0 | 4,228.7 | 5,307.0 | 6,679.7 | 7,266.5 | 5,834.4 |
| 2000's | 5,154.9 | 5,130.7 | 3,553.6 | 3,603.4 | 3,536.4 | 3,109.2 | 2,986.6 | 3,140.1 | 3,171.0 | 2,752.2 |
| 2010's | 2,591.0 | 2,068.4 | 2,232.7 | 2,055.4 | 2,488.4 | 2,970.4 | 3,119.1 | 3,368.7 | 3,620.7 | 3,566.5 |
| 2020's | 2,684.7 |
| - = No Data Reported; -- = Not Applicable; NA = Not Available; W = Withheld to avoid disclosure of individual company data. |
| Release Date: 6/1/2022 |
| Next Release Date: TBD |