|
Download Data (XLS File) |
|
||||||||
|
||||||||
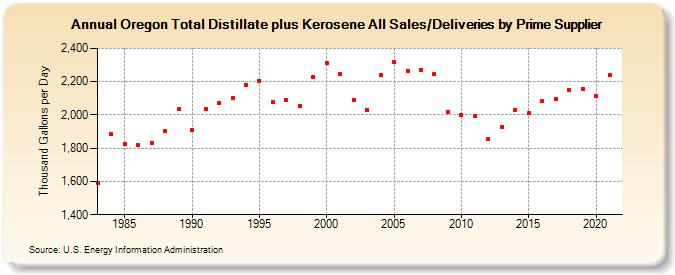
| Oregon Total Distillate plus Kerosene All Sales/Deliveries by Prime Supplier (Thousand Gallons per Day) | ||||||||
| Decade | Year-0 | Year-1 | Year-2 | Year-3 | Year-4 | Year-5 | Year-6 | Year-7 | Year-8 | Year-9 |
|---|---|---|---|---|---|---|---|---|---|---|
| 1980's | 1,590.9 | 1,883.3 | 1,827.5 | 1,816.3 | 1,832.6 | 1,900.5 | 2,036.6 | |||
| 1990's | 1,909.8 | 2,035.4 | 2,071.3 | 2,100.2 | 2,182.8 | 2,204.8 | 2,077.1 | 2,092.1 | 2,056.0 | 2,226.7 |
| 2000's | 2,310.4 | 2,245.5 | 2,088.9 | 2,030.4 | 2,238.0 | 2,319.6 | 2,266.6 | 2,271.7 | 2,243.6 | 2,017.3 |
| 2010's | 1,999.1 | 1,993.3 | 1,857.0 | 1,930.2 | 2,031.2 | 2,010.8 | 2,081.6 | 2,097.8 | 2,149.3 | 2,156.3 |
| 2020's | 2,115.2 |
| - = No Data Reported; -- = Not Applicable; NA = Not Available; W = Withheld to avoid disclosure of individual company data. |
| Release Date: 6/1/2022 |
| Next Release Date: TBD |