|
Download Data (XLS File) |
|
||||||||
|
||||||||
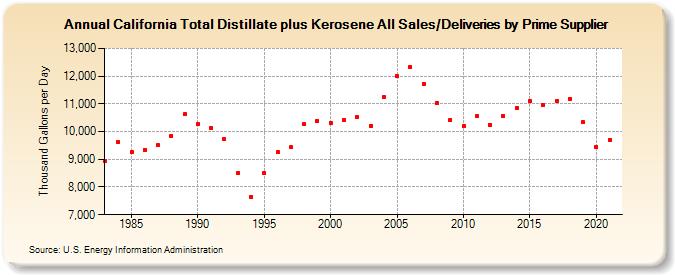
| California Total Distillate plus Kerosene All Sales/Deliveries by Prime Supplier (Thousand Gallons per Day) | ||||||||
| Decade | Year-0 | Year-1 | Year-2 | Year-3 | Year-4 | Year-5 | Year-6 | Year-7 | Year-8 | Year-9 |
|---|---|---|---|---|---|---|---|---|---|---|
| 1980's | 8,926.3 | 9,626.6 | 9,261.6 | 9,347.0 | 9,499.4 | 9,844.1 | 10,621.4 | |||
| 1990's | 10,272.5 | 10,121.8 | 9,716.0 | 8,496.2 | 7,651.1 | 8,511.4 | 9,247.0 | 9,430.3 | 10,263.3 | 10,377.5 |
| 2000's | 10,314.3 | 10,415.3 | 10,514.5 | 10,211.6 | 11,261.6 | 11,987.0 | 12,328.8 | 11,730.2 | 11,025.5 | 10,434.5 |
| 2010's | 10,195.9 | 10,545.3 | 10,246.6 | 10,558.7 | 10,859.0 | 11,095.9 | 10,961.5 | 11,110.6 | 11,185.7 | 10,332.4 |
| 2020's | 9,441.7 |
| - = No Data Reported; -- = Not Applicable; NA = Not Available; W = Withheld to avoid disclosure of individual company data. |
| Release Date: 6/1/2022 |
| Next Release Date: TBD |