|
Download Data (XLS File) |
|
||||||||
|
||||||||
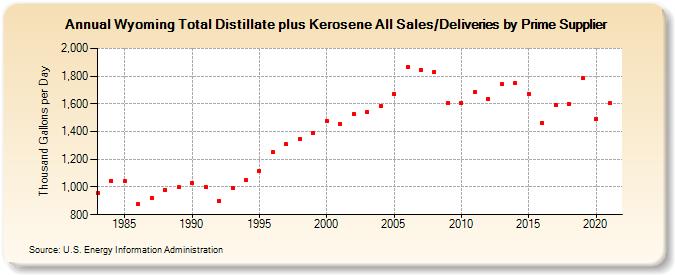
| Wyoming Total Distillate plus Kerosene All Sales/Deliveries by Prime Supplier (Thousand Gallons per Day) | ||||||||
| Decade | Year-0 | Year-1 | Year-2 | Year-3 | Year-4 | Year-5 | Year-6 | Year-7 | Year-8 | Year-9 |
|---|---|---|---|---|---|---|---|---|---|---|
| 1980's | 960.2 | 1,045.3 | 1,042.3 | 874.5 | 923.1 | 981.4 | 996.6 | |||
| 1990's | 1,026.2 | 1,001.7 | 901.5 | 995.5 | 1,047.6 | 1,117.1 | 1,251.1 | 1,307.5 | 1,348.7 | 1,388.8 |
| 2000's | 1,477.0 | 1,454.3 | 1,530.0 | 1,542.8 | 1,584.4 | 1,671.7 | 1,864.1 | 1,842.5 | 1,832.4 | 1,606.1 |
| 2010's | 1,607.0 | 1,687.4 | 1,638.0 | 1,742.4 | 1,750.9 | 1,673.5 | 1,462.1 | 1,594.9 | 1,601.1 | 1,783.8 |
| 2020's | 1,493.1 |
| - = No Data Reported; -- = Not Applicable; NA = Not Available; W = Withheld to avoid disclosure of individual company data. |
| Release Date: 6/1/2022 |
| Next Release Date: TBD |