|
Download Data (XLS File) |
|
||||||||
|
||||||||
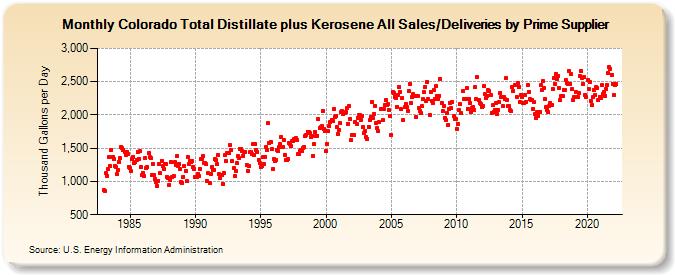
| Colorado Total Distillate plus Kerosene All Sales/Deliveries by Prime Supplier (Thousand Gallons per Day) | ||||||||
| Year | Jan | Feb | Mar | Apr | May | Jun | Jul | Aug | Sep | Oct | Nov | Dec |
|---|---|---|---|---|---|---|---|---|---|---|---|---|
| 1983 | 866.8 | 853.8 | 1,122.6 | 1,086.8 | 1,189.5 | 1,369.8 | 1,234.9 | 1,476.7 | 1,370.1 | 1,338.2 | 1,238.2 | 1,224.2 |
| 1984 | 1,106.5 | 1,179.1 | 1,297.6 | 1,347.3 | 1,519.7 | 1,498.0 | 1,473.0 | 1,438.6 | 1,399.1 | 1,444.2 | 1,417.7 | 1,219.1 |
| 1985 | 1,196.0 | 1,152.3 | 1,336.2 | 1,365.2 | 1,278.8 | 1,290.5 | 1,326.3 | 1,448.8 | 1,343.6 | 1,450.3 | 1,216.0 | 1,095.2 |
| 1986 | 1,131.1 | 1,079.3 | 1,348.8 | 1,198.1 | 1,220.3 | 1,425.5 | 1,361.6 | 1,351.9 | 1,091.2 | 1,268.9 | 1,090.7 | 1,041.0 |
| 1987 | 994.3 | 930.5 | 1,012.9 | 1,264.3 | 1,120.4 | 1,312.3 | 1,229.7 | 1,194.2 | 1,263.3 | 1,261.9 | 1,071.7 | 1,049.7 |
| 1988 | 947.6 | 1,015.9 | 1,290.5 | 1,059.8 | 1,082.7 | 1,287.0 | 1,251.0 | 1,376.0 | 1,238.1 | 1,261.5 | 1,183.2 | 998.7 |
| 1989 | 978.4 | 1,070.9 | 1,226.3 | 1,161.2 | 1,006.4 | 1,365.5 | 1,265.1 | 1,312.7 | 1,295.5 | 1,313.6 | 1,216.3 | 1,187.7 |
| 1990 | 1,068.9 | 1,072.8 | 1,109.8 | 1,087.0 | 1,192.1 | 1,331.2 | 1,335.5 | 1,380.7 | 1,279.2 | 1,279.4 | 1,258.9 | 1,000.0 |
| 1991 | 1,122.0 | 969.8 | 1,107.0 | 1,214.9 | 1,176.7 | 1,179.2 | 1,339.9 | 1,324.1 | 1,254.8 | 1,397.5 | 1,108.3 | 1,055.8 |
| 1992 | 1,096.9 | 966.1 | 1,127.2 | 1,390.5 | 1,307.6 | 1,427.5 | 1,433.4 | 1,420.3 | 1,547.0 | 1,469.2 | 1,301.4 | 1,204.7 |
| 1993 | 1,075.4 | 1,155.8 | 1,273.4 | 1,377.7 | 1,357.1 | 1,490.8 | 1,488.5 | 1,459.2 | 1,386.7 | 1,435.3 | 1,442.0 | 1,251.7 |
| 1994 | 1,160.7 | 1,229.9 | 1,438.2 | 1,448.9 | 1,406.0 | 1,565.9 | 1,397.2 | 1,561.3 | 1,474.1 | 1,447.4 | 1,321.3 | 1,274.5 |
| 1995 | 1,212.2 | 1,234.3 | 1,365.8 | 1,268.0 | 1,372.8 | 1,517.8 | 1,480.2 | 1,873.1 | 1,571.2 | 1,593.8 | 1,489.6 | 1,180.1 |
| 1996 | 1,334.0 | 1,312.0 | 1,320.7 | 1,479.9 | 1,455.1 | 1,516.2 | 1,555.8 | 1,671.2 | 1,524.4 | 1,627.8 | 1,404.6 | 1,317.2 |
| 1997 | 1,318.3 | 1,334.8 | 1,580.6 | 1,567.4 | 1,530.3 | 1,605.4 | 1,615.4 | 1,640.5 | 1,648.3 | 1,620.3 | 1,409.9 | 1,417.5 |
| 1998 | 1,455.2 | 1,476.0 | 1,458.9 | 1,504.6 | 1,523.1 | 1,681.3 | 1,705.3 | 1,749.5 | 1,740.5 | 1,731.7 | 1,664.5 | 1,687.3 |
| 1999 | 1,387.3 | 1,556.2 | 1,743.2 | 1,688.0 | 1,690.0 | 1,933.8 | 1,805.3 | 1,815.3 | 1,830.8 | 2,052.1 | 1,787.0 | 1,756.5 |
| 2000 | 1,450.7 | 1,567.0 | 1,754.9 | 1,829.1 | 1,898.6 | 1,928.8 | 1,914.4 | 2,085.8 | 1,971.5 | 1,991.0 | 1,814.7 | 1,714.6 |
| 2001 | 1,776.8 | 1,875.7 | 2,038.5 | 2,052.4 | 2,008.8 | 2,033.1 | 2,042.9 | 2,098.1 | 1,868.1 | 2,131.0 | 1,944.6 | 1,623.1 |
| 2002 | 1,693.2 | 1,701.0 | 1,695.8 | 1,895.3 | 1,868.7 | 1,960.5 | 1,991.6 | 1,997.4 | 1,929.0 | 1,984.3 | 1,815.5 | 1,726.0 |
| 2003 | 1,761.1 | 1,671.7 | 1,642.9 | 1,823.0 | 1,926.7 | 1,974.9 | 2,190.6 | 1,952.4 | 2,021.1 | 2,135.8 | 1,880.5 | 1,805.4 |
| 2004 | 1,755.6 | 1,889.5 | 2,090.2 | 2,087.6 | 1,917.0 | 2,086.8 | 2,151.5 | 2,220.6 | 2,153.4 | 2,158.1 | 2,067.6 | 1,980.7 |
| 2005 | 1,700.4 | 2,349.9 | 2,333.7 | 2,273.5 | 2,249.7 | 2,125.4 | 2,305.0 | 2,423.8 | 2,351.5 | 2,083.3 | 2,257.6 | 1,923.1 |
| 2006 | 2,118.6 | 2,166.8 | 2,119.8 | 2,063.6 | 2,364.6 | 2,466.7 | 2,175.5 | 2,271.9 | 2,311.8 | 2,284.9 | 2,283.0 | 1,961.5 |
| 2007 | 2,276.9 | 2,109.6 | 2,062.4 | 2,028.4 | 2,128.9 | 2,235.4 | 2,340.5 | 2,424.6 | 2,214.3 | 2,496.6 | 2,238.7 | 2,004.1 |
| 2008 | 2,346.8 | 2,202.1 | 2,179.8 | 2,371.2 | 2,243.4 | 2,431.9 | 2,279.0 | 2,241.9 | 2,290.1 | 2,538.1 | 2,180.0 | 2,060.9 |
| 2009 | 2,132.6 | 1,961.0 | 1,920.7 | 2,029.9 | 1,849.8 | 2,090.4 | 2,180.9 | 2,098.7 | 2,188.8 | 1,977.7 | 1,943.0 | 1,944.2 |
| 2010 | 1,790.2 | 1,864.9 | 2,070.3 | 2,161.7 | 2,023.4 | NA | 2,364.5 | 2,233.9 | 2,236.3 | 2,407.5 | 2,094.7 | 2,237.8 |
| 2011 | 2,182.9 | 2,050.0 | 2,106.3 | 2,123.7 | 2,071.2 | 2,415.2 | 2,233.3 | 2,565.9 | 2,220.8 | 2,185.7 | 2,167.6 | 2,116.1 |
| 2012 | 2,140.4 | 2,427.6 | 2,320.5 | 2,260.6 | 2,291.7 | 2,368.0 | 2,362.4 | 2,302.9 | 2,030.9 | 2,141.9 | 2,046.1 | 2,071.1 |
| 2013 | 2,179.7 | 2,015.6 | 2,075.0 | 2,195.4 | 2,331.9 | 2,268.3 | 2,131.7 | 2,276.1 | 2,234.6 | 2,548.9 | 2,225.4 | 2,136.3 |
| 2014 | 2,130.0 | 2,067.5 | 2,053.2 | 2,414.3 | 2,353.5 | 2,447.2 | 2,443.8 | 2,271.3 | 2,481.4 | 2,425.8 | 2,191.1 | 2,298.7 |
| 2015 | 2,270.3 | 2,184.9 | 2,172.7 | 2,302.4 | 2,199.5 | 2,447.8 | 2,347.7 | 2,235.0 | 2,230.8 | 2,229.1 | 2,086.2 | 2,187.4 |
| 2016 | 2,007.4 | 1,950.8 | 2,038.5 | 1,988.8 | 2,049.7 | 2,442.9 | 2,371.2 | 2,507.5 | 2,401.6 | 2,235.3 | 2,114.0 | 2,078.0 |
| 2017 | 2,041.0 | 2,134.1 | 2,178.7 | 2,153.5 | 2,386.4 | 2,554.6 | 2,468.9 | 2,620.8 | 2,543.0 | 2,586.9 | 2,408.6 | 2,219.5 |
| 2018 | 2,289.1 | 2,278.8 | 2,375.2 | 2,374.9 | 2,524.4 | 2,479.8 | 2,465.7 | 2,664.6 | 2,469.0 | 2,609.5 | 2,384.9 | 2,223.7 |
| 2019 | 2,264.1 | 2,342.7 | 2,262.6 | 2,274.6 | 2,333.2 | 2,591.9 | 2,657.3 | 2,562.0 | 2,466.1 | 2,566.3 | 2,302.1 | 2,267.7 |
| 2020 | 2,525.9 | 2,391.2 | 2,488.8 | 2,210.4 | 2,149.0 | 2,268.8 | 2,381.3 | 2,298.7 | 2,415.1 | 2,407.8 | 2,221.7 | 2,270.2 |
| 2021 | 2,261.6 | 2,445.3 | 2,314.2 | 2,342.0 | 2,288.3 | 2,395.8 | 2,456.8 | 2,625.6 | 2,713.7 | 2,692.1 | 2,606.0 | 2,471.0 |
| 2022 | 2,299.5 | 2,443.9 | 2,464.1 | |||||||||
| - = No Data Reported; -- = Not Applicable; NA = Not Available; W = Withheld to avoid disclosure of individual company data. |
| Release Date: 5/19/2022 |
| Next Release Date: TBD |