|
Download Data (XLS File) |
|
||||||||
|
||||||||
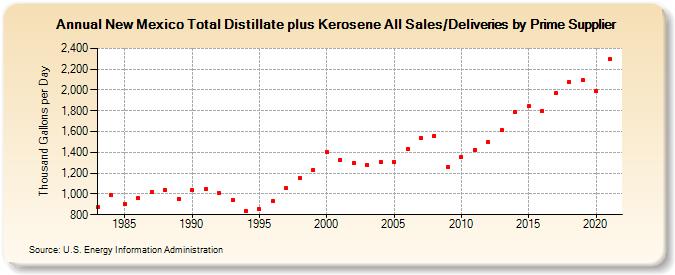
| New Mexico Total Distillate plus Kerosene All Sales/Deliveries by Prime Supplier (Thousand Gallons per Day) | ||||||||
| Decade | Year-0 | Year-1 | Year-2 | Year-3 | Year-4 | Year-5 | Year-6 | Year-7 | Year-8 | Year-9 |
|---|---|---|---|---|---|---|---|---|---|---|
| 1980's | 871.7 | 991.3 | 904.8 | 959.6 | 1,017.1 | 1,040.8 | 955.1 | |||
| 1990's | 1,033.5 | 1,045.9 | 1,010.9 | 945.5 | 835.4 | 851.9 | 928.4 | 1,054.1 | 1,152.3 | 1,232.6 |
| 2000's | 1,407.7 | 1,329.1 | 1,299.3 | 1,279.2 | 1,311.8 | 1,311.4 | 1,430.9 | 1,540.0 | 1,561.0 | 1,258.4 |
| 2010's | 1,354.6 | 1,424.6 | 1,499.0 | 1,616.3 | 1,784.6 | 1,842.3 | 1,798.9 | 1,971.1 | 2,077.2 | 2,092.9 |
| 2020's | 1,986.2 |
| - = No Data Reported; -- = Not Applicable; NA = Not Available; W = Withheld to avoid disclosure of individual company data. |
| Release Date: 6/1/2022 |
| Next Release Date: TBD |