|
Download Data (XLS File) |
|
||||||||
|
||||||||
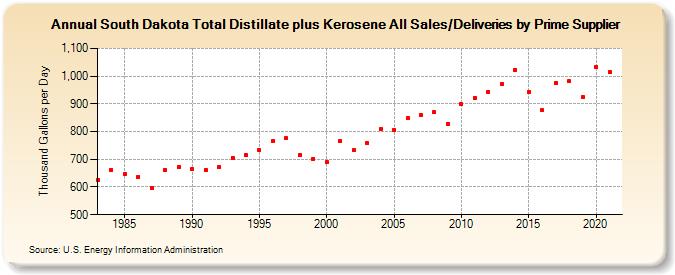
| South Dakota Total Distillate plus Kerosene All Sales/Deliveries by Prime Supplier (Thousand Gallons per Day) | ||||||||
| Decade | Year-0 | Year-1 | Year-2 | Year-3 | Year-4 | Year-5 | Year-6 | Year-7 | Year-8 | Year-9 |
|---|---|---|---|---|---|---|---|---|---|---|
| 1980's | 626.2 | 663.0 | 646.8 | 637.2 | 596.7 | 662.6 | 673.3 | |||
| 1990's | 664.2 | 662.3 | 673.6 | 705.5 | 715.0 | 731.8 | 764.7 | 775.8 | 716.2 | 702.7 |
| 2000's | 689.8 | 765.5 | 733.2 | 758.1 | 808.7 | 807.1 | 847.1 | 861.4 | 869.1 | 828.4 |
| 2010's | 897.8 | 922.5 | 942.9 | 972.8 | 1,022.9 | 942.2 | 876.5 | 975.3 | 981.2 | 924.6 |
| 2020's | 1,033.5 |
| - = No Data Reported; -- = Not Applicable; NA = Not Available; W = Withheld to avoid disclosure of individual company data. |
| Release Date: 6/1/2022 |
| Next Release Date: TBD |