|
Download Data (XLS File) |
|
||||||||
|
||||||||
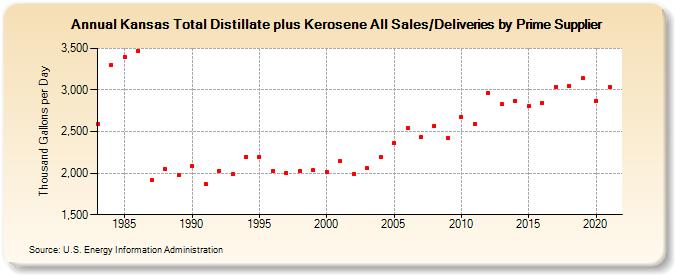
| Kansas Total Distillate plus Kerosene All Sales/Deliveries by Prime Supplier (Thousand Gallons per Day) | ||||||||
| Decade | Year-0 | Year-1 | Year-2 | Year-3 | Year-4 | Year-5 | Year-6 | Year-7 | Year-8 | Year-9 |
|---|---|---|---|---|---|---|---|---|---|---|
| 1980's | 2,586.7 | 3,300.7 | 3,401.5 | 3,472.4 | 1,912.7 | 2,045.5 | 1,976.5 | |||
| 1990's | 2,086.2 | 1,874.4 | 2,029.6 | 1,986.4 | 2,199.6 | 2,197.9 | 2,030.4 | 2,001.1 | 2,028.5 | 2,031.9 |
| 2000's | 2,013.9 | 2,142.9 | 1,995.5 | 2,057.0 | 2,189.3 | 2,356.6 | 2,540.4 | 2,429.6 | 2,568.1 | 2,424.9 |
| 2010's | 2,673.9 | 2,595.4 | 2,967.1 | 2,831.6 | 2,872.4 | 2,807.0 | 2,849.0 | 3,039.3 | 3,053.6 | 3,139.9 |
| 2020's | 2,870.5 |
| - = No Data Reported; -- = Not Applicable; NA = Not Available; W = Withheld to avoid disclosure of individual company data. |
| Release Date: 6/1/2022 |
| Next Release Date: TBD |