|
Download Data (XLS File) |
|
||||||||
|
||||||||
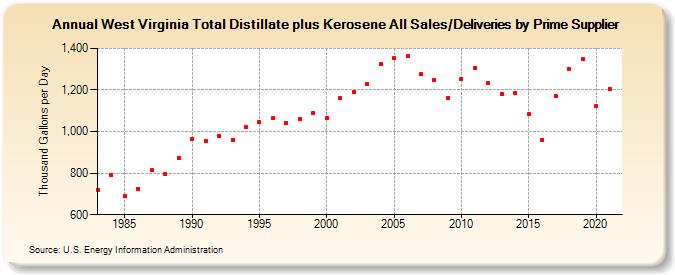
| West Virginia Total Distillate plus Kerosene All Sales/Deliveries by Prime Supplier (Thousand Gallons per Day) | ||||||||
| Decade | Year-0 | Year-1 | Year-2 | Year-3 | Year-4 | Year-5 | Year-6 | Year-7 | Year-8 | Year-9 |
|---|---|---|---|---|---|---|---|---|---|---|
| 1980's | 720.8 | 793.2 | 690.6 | 723.7 | 813.0 | 796.9 | 873.8 | |||
| 1990's | 965.3 | 956.2 | 977.8 | 961.4 | 1,020.3 | 1,044.3 | 1,062.9 | 1,043.0 | 1,058.5 | 1,090.3 |
| 2000's | 1,066.3 | 1,160.9 | 1,192.4 | 1,227.9 | 1,323.1 | 1,351.8 | 1,363.3 | 1,276.6 | 1,250.0 | 1,163.7 |
| 2010's | 1,254.6 | 1,304.6 | 1,234.0 | 1,181.4 | 1,187.2 | 1,082.3 | 960.2 | 1,172.8 | 1,302.7 | 1,350.1 |
| 2020's | 1,122.0 |
| - = No Data Reported; -- = Not Applicable; NA = Not Available; W = Withheld to avoid disclosure of individual company data. |
| Release Date: 6/1/2022 |
| Next Release Date: TBD |