|
Download Data (XLS File) |
|
||||||||
|
||||||||
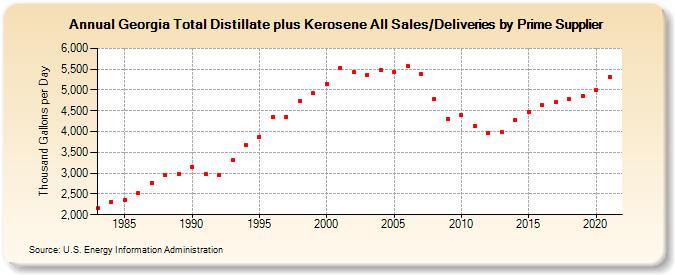
| Georgia Total Distillate plus Kerosene All Sales/Deliveries by Prime Supplier (Thousand Gallons per Day) | ||||||||
| Decade | Year-0 | Year-1 | Year-2 | Year-3 | Year-4 | Year-5 | Year-6 | Year-7 | Year-8 | Year-9 |
|---|---|---|---|---|---|---|---|---|---|---|
| 1980's | 2,154.7 | 2,315.1 | 2,348.8 | 2,510.4 | 2,763.1 | 2,966.9 | 2,989.1 | |||
| 1990's | 3,144.1 | 2,976.8 | 2,963.5 | 3,311.1 | 3,676.1 | 3,876.1 | 4,339.2 | 4,353.1 | 4,725.2 | 4,918.1 |
| 2000's | 5,143.7 | 5,535.4 | 5,429.4 | 5,351.7 | 5,484.2 | 5,432.4 | 5,579.6 | 5,384.1 | 4,790.1 | 4,300.6 |
| 2010's | 4,388.1 | 4,139.7 | 3,969.7 | 3,979.3 | 4,284.7 | 4,472.0 | 4,632.7 | 4,699.3 | 4,785.9 | 4,860.3 |
| 2020's | 4,988.9 |
| - = No Data Reported; -- = Not Applicable; NA = Not Available; W = Withheld to avoid disclosure of individual company data. |
| Release Date: 6/1/2022 |
| Next Release Date: TBD |