|
Download Data (XLS File) |
|
||||||||
|
||||||||
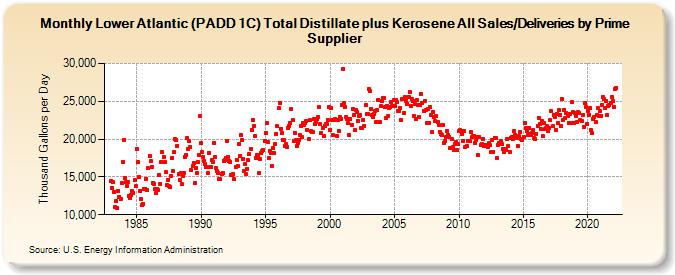
| Lower Atlantic (PADD 1C) Total Distillate plus Kerosene All Sales/Deliveries by Prime Supplier (Thousand Gallons per Day) | ||||||||
| Year | Jan | Feb | Mar | Apr | May | Jun | Jul | Aug | Sep | Oct | Nov | Dec |
|---|---|---|---|---|---|---|---|---|---|---|---|---|
| 1983 | 14,474.0 | 13,567.0 | 14,315.5 | 13,042.9 | 11,063.9 | 11,774.3 | 10,869.1 | 13,191.2 | 12,405.6 | 12,036.9 | 14,219.0 | 17,011.0 |
| 1984 | 19,916.8 | 14,863.7 | 14,270.2 | 13,829.0 | 14,323.1 | 12,435.6 | 12,264.8 | 12,562.8 | 13,120.7 | 12,909.2 | 14,644.4 | 13,750.0 |
| 1985 | 18,684.9 | 16,921.6 | 14,985.5 | 13,158.7 | 12,122.9 | 11,284.8 | 11,414.0 | 13,339.4 | 13,449.0 | 14,737.7 | 13,208.1 | 16,121.2 |
| 1986 | 17,794.7 | 17,134.9 | 16,353.0 | 14,233.1 | 14,030.7 | 13,360.4 | 12,864.2 | 13,433.5 | 13,289.2 | 15,276.7 | 14,069.2 | 16,998.4 |
| 1987 | 18,272.7 | 17,682.0 | 16,984.6 | 15,607.9 | 13,981.2 | 14,608.7 | 13,813.4 | 13,642.9 | 15,158.9 | 17,486.9 | 15,745.6 | 18,326.5 |
| 1988 | 19,954.3 | 19,859.4 | 19,147.2 | 15,318.3 | 14,619.2 | 15,521.1 | 14,017.8 | 15,143.0 | 15,565.7 | 17,673.7 | 17,932.7 | 20,190.7 |
| 1989 | 18,724.4 | 19,796.9 | 18,890.4 | 15,863.4 | 16,413.0 | 16,830.5 | 14,177.3 | 16,115.7 | 15,540.4 | 16,999.9 | 17,909.5 | 23,008.1 |
| 1990 | 19,444.6 | 18,277.2 | 17,607.8 | 17,067.6 | 16,696.0 | 16,342.2 | 15,455.9 | 18,186.8 | 16,318.5 | 16,274.7 | 17,192.6 | 16,945.3 |
| 1991 | 19,549.1 | 17,637.3 | 16,143.1 | 15,730.6 | 15,505.2 | 14,751.4 | 14,685.1 | 15,449.4 | 15,571.9 | 17,152.2 | 17,211.5 | 17,508.9 |
| 1992 | 19,769.7 | 17,692.2 | 17,109.8 | 17,015.7 | 15,279.1 | 15,216.9 | 15,366.1 | 14,677.2 | 16,314.9 | 17,292.8 | 16,418.2 | 19,327.9 |
| 1993 | 17,777.8 | 20,532.5 | 19,880.0 | 17,352.2 | 15,725.3 | 16,718.8 | 15,363.0 | 16,066.5 | 17,175.4 | 18,002.1 | 18,735.3 | 21,267.6 |
| 1994 | 22,581.0 | 21,787.5 | 20,409.4 | 17,484.2 | 17,877.9 | 17,808.7 | 15,503.7 | 17,317.9 | 18,176.2 | 18,395.9 | 18,547.8 | 19,795.9 |
| 1995 | 20,786.0 | 22,113.8 | 19,623.9 | 17,448.3 | 18,457.6 | 18,171.3 | 16,504.4 | 18,795.3 | 18,140.8 | 19,342.3 | 20,709.1 | 21,681.1 |
| 1996 | 24,142.7 | 24,821.7 | 21,382.2 | 20,812.4 | 19,938.5 | 19,842.2 | 19,150.8 | 19,358.0 | 18,977.0 | 21,431.4 | 21,721.2 | 22,163.2 |
| 1997 | 23,935.1 | 22,523.2 | 19,714.0 | 20,871.4 | 19,834.2 | 19,082.8 | 19,429.9 | 19,885.1 | 20,477.8 | 21,689.6 | 20,264.7 | 22,179.1 |
| 1998 | 21,880.4 | 22,117.0 | 22,400.8 | 21,238.2 | 19,983.5 | 22,484.3 | 21,019.4 | 20,926.4 | 20,954.2 | 22,635.8 | 21,961.0 | 22,316.6 |
| 1999 | 22,625.6 | 22,901.5 | 24,289.7 | 21,998.8 | 20,753.6 | 21,424.6 | 20,361.7 | 21,699.1 | 22,010.0 | 21,963.5 | 22,588.3 | 24,179.5 |
| 2000 | 21,256.2 | 24,070.4 | 22,495.7 | 20,505.4 | 22,579.4 | 22,662.5 | 20,443.4 | 22,524.6 | 21,126.9 | 22,863.5 | 22,693.9 | 24,572.6 |
| 2001 | 29,240.8 | 24,741.5 | 24,184.8 | 22,904.5 | 22,632.4 | 22,088.9 | 20,478.3 | 22,676.3 | 21,854.4 | 24,037.4 | 23,157.7 | 21,166.5 |
| 2002 | 23,874.9 | 23,595.5 | 22,407.5 | 23,090.4 | 23,208.9 | 21,512.9 | 21,492.7 | 22,532.8 | 21,791.3 | 24,522.7 | 23,255.5 | 23,267.3 |
| 2003 | 26,586.3 | 26,299.5 | 23,925.6 | 23,155.3 | 22,880.9 | 23,328.1 | 23,653.7 | 22,298.5 | 23,836.6 | 25,110.5 | 22,317.5 | 24,328.4 |
| 2004 | 25,049.3 | 25,489.0 | 25,448.0 | 24,210.2 | 22,790.8 | 24,420.9 | 23,038.3 | 24,079.8 | 24,239.5 | 24,917.0 | 24,440.3 | 25,168.7 |
| 2005 | 24,376.5 | 25,161.3 | 24,943.2 | 23,755.7 | 23,718.4 | 24,066.8 | 22,491.6 | 25,353.1 | 25,330.0 | 23,469.5 | 25,622.7 | 25,073.1 |
| 2006 | 24,669.1 | 25,591.3 | 26,236.8 | 24,413.0 | 25,304.3 | 25,085.3 | 23,022.5 | 24,592.0 | 22,676.7 | 25,104.6 | 24,472.1 | 22,931.4 |
| 2007 | 24,454.7 | 25,946.5 | 24,835.7 | 23,705.8 | 25,007.2 | 23,789.1 | 22,130.4 | 23,935.5 | 22,171.2 | 24,195.1 | 23,131.5 | 20,895.9 |
| 2008 | 23,601.2 | 22,937.9 | 22,350.0 | 22,994.9 | 22,252.2 | 21,890.6 | 20,982.5 | 20,645.8 | 20,591.5 | 21,929.0 | 19,534.2 | 19,745.9 |
| 2009 | 20,297.7 | 21,099.0 | 20,577.2 | 20,330.7 | 18,868.3 | 19,988.9 | 18,935.0 | 18,597.5 | 19,375.7 | 19,631.1 | 18,493.1 | 19,312.0 |
| 2010 | 21,006.1 | 21,196.1 | 21,099.7 | 20,645.0 | 19,756.9 | 21,027.7 | 18,977.0 | 19,034.1 | 19,808.7 | 19,695.0 | 19,737.6 | 20,893.1 |
| 2011 | 20,273.0 | 20,402.3 | 20,447.4 | 19,509.0 | 19,867.0 | 20,334.0 | 17,894.8 | 20,309.8 | 19,251.3 | 19,368.5 | 20,027.8 | 19,026.0 |
| 2012 | 19,274.1 | 19,214.2 | 19,087.9 | 18,894.3 | 19,427.6 | 19,165.3 | 18,349.1 | 19,912.5 | 18,326.2 | 20,170.7 | 20,117.1 | 17,523.7 |
| 2013 | 19,249.8 | 19,510.3 | 19,505.1 | 19,765.5 | 19,294.1 | 18,694.9 | 18,234.5 | 18,643.5 | 18,611.4 | 20,023.4 | 19,054.1 | 18,359.1 |
| 2014 | 20,185.1 | 20,291.5 | 19,983.0 | 21,006.8 | 20,600.8 | 20,332.0 | 20,175.8 | 19,068.3 | 20,370.4 | 20,904.9 | 19,947.3 | 19,873.1 |
| 2015 | 20,300.0 | 22,077.9 | 21,437.9 | 21,053.1 | 20,601.0 | 21,502.5 | 20,656.7 | 20,598.5 | 20,750.3 | 21,150.6 | 20,125.5 | 19,972.5 |
| 2016 | 20,721.9 | 21,770.4 | 22,832.9 | 21,992.5 | 21,312.5 | 22,382.6 | 20,371.6 | 22,076.0 | 21,299.1 | 21,423.8 | 21,776.6 | 21,005.6 |
| 2017 | 21,478.4 | 22,509.9 | 23,748.5 | 21,669.7 | 23,229.0 | 22,867.7 | 21,264.2 | 23,362.0 | 22,099.9 | 23,895.8 | 23,236.4 | 21,669.9 |
| 2018 | 25,289.9 | 22,589.4 | 23,830.2 | 22,725.4 | 23,424.8 | 23,004.0 | 22,190.4 | 23,369.1 | 22,180.7 | 24,883.4 | 23,597.2 | 22,090.7 |
| 2019 | 23,474.7 | 23,093.5 | 22,307.5 | 23,522.3 | 23,409.0 | 22,525.6 | 22,439.5 | 23,124.9 | 21,636.8 | 24,709.4 | 24,268.5 | 22,011.2 |
| 2020 | 23,669.2 | 23,218.5 | 24,141.4 | 21,140.8 | 20,760.9 | 22,670.6 | 22,880.7 | 22,288.8 | 23,234.6 | 24,074.7 | 23,099.5 | 23,652.0 |
| 2021 | 23,111.7 | 24,543.8 | 25,597.8 | 25,246.1 | 24,087.9 | 25,027.6 | 23,174.7 | 24,327.2 | 24,544.1 | 24,791.9 | 25,618.0 | 25,088.6 |
| 2022 | 24,294.0 | 26,661.1 | 26,763.8 | |||||||||
| - = No Data Reported; -- = Not Applicable; NA = Not Available; W = Withheld to avoid disclosure of individual company data. |
| Release Date: 5/19/2022 |
| Next Release Date: TBD |