|
Download Data (XLS File) |
|
||||||||
|
||||||||
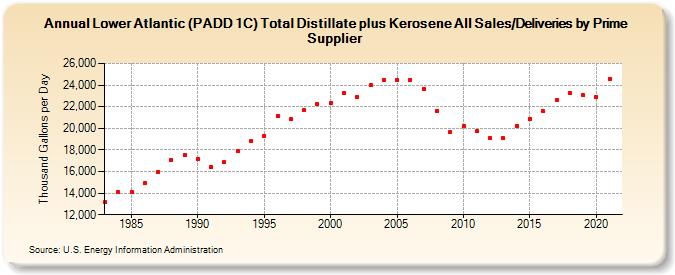
| Lower Atlantic (PADD 1C) Total Distillate plus Kerosene All Sales/Deliveries by Prime Supplier (Thousand Gallons per Day) | ||||||||
| Decade | Year-0 | Year-1 | Year-2 | Year-3 | Year-4 | Year-5 | Year-6 | Year-7 | Year-8 | Year-9 |
|---|---|---|---|---|---|---|---|---|---|---|
| 1980's | 13,164.2 | 14,076.1 | 14,110.7 | 14,897.6 | 15,935.6 | 17,074.3 | 17,514.6 | |||
| 1990's | 17,146.1 | 16,404.3 | 16,837.1 | 17,865.5 | 18,791.5 | 19,299.1 | 21,133.8 | 20,817.0 | 21,656.1 | 22,230.0 |
| 2000's | 22,312.8 | 23,259.8 | 22,878.6 | 23,966.6 | 24,436.5 | 24,438.2 | 24,503.2 | 23,669.9 | 21,618.1 | 19,614.3 |
| 2010's | 20,231.2 | 19,719.7 | 19,121.4 | 19,075.8 | 20,225.7 | 20,842.1 | 21,576.3 | 22,587.8 | 23,274.4 | 23,043.8 |
| 2020's | 22,904.9 |
| - = No Data Reported; -- = Not Applicable; NA = Not Available; W = Withheld to avoid disclosure of individual company data. |
| Release Date: 6/1/2022 |
| Next Release Date: TBD |