|
Download Data (XLS File) |
|
||||||||
|
||||||||
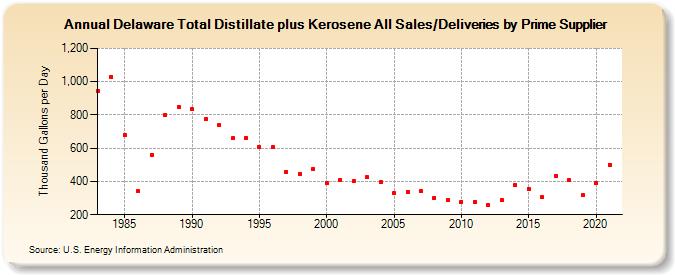
| Delaware Total Distillate plus Kerosene All Sales/Deliveries by Prime Supplier (Thousand Gallons per Day) | ||||||||
| Decade | Year-0 | Year-1 | Year-2 | Year-3 | Year-4 | Year-5 | Year-6 | Year-7 | Year-8 | Year-9 |
|---|---|---|---|---|---|---|---|---|---|---|
| 1980's | 944.5 | 1,030.4 | 679.2 | 341.2 | 561.1 | 800.6 | 849.8 | |||
| 1990's | 832.9 | 774.2 | 736.6 | 659.2 | 663.9 | 604.7 | 605.1 | 459.8 | 446.9 | 474.7 |
| 2000's | 388.0 | 410.1 | 400.7 | 425.0 | 395.5 | 328.4 | 338.1 | 341.0 | 301.5 | 287.2 |
| 2010's | 278.9 | 278.7 | 258.2 | 288.5 | 375.7 | 356.5 | 303.6 | 435.5 | 406.3 | 316.3 |
| 2020's | 392.5 |
| - = No Data Reported; -- = Not Applicable; NA = Not Available; W = Withheld to avoid disclosure of individual company data. |
| Release Date: 6/1/2022 |
| Next Release Date: TBD |