|
Download Data (XLS File) |
|
||||||||
|
||||||||
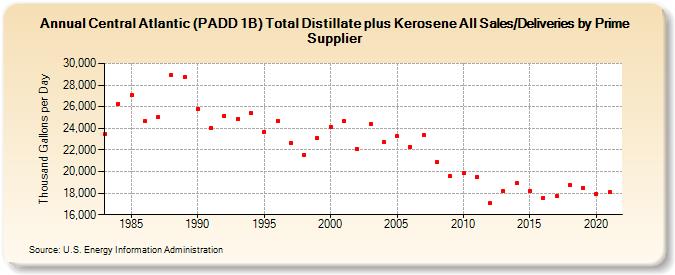
| Central Atlantic (PADD 1B) Total Distillate plus Kerosene All Sales/Deliveries by Prime Supplier (Thousand Gallons per Day) | ||||||||
| Decade | Year-0 | Year-1 | Year-2 | Year-3 | Year-4 | Year-5 | Year-6 | Year-7 | Year-8 | Year-9 |
|---|---|---|---|---|---|---|---|---|---|---|
| 1980's | 23,460.8 | 26,282.5 | 27,053.8 | 24,648.8 | 25,030.7 | 28,970.3 | 28,703.1 | |||
| 1990's | 25,819.6 | 24,034.6 | 25,170.6 | 24,902.4 | 25,398.0 | 23,682.8 | 24,717.5 | 22,663.1 | 21,553.5 | 23,098.8 |
| 2000's | 24,152.0 | 24,653.2 | 22,065.9 | 24,398.6 | 22,735.6 | 23,263.1 | 22,272.3 | 23,346.0 | 20,851.4 | 19,553.6 |
| 2010's | 19,829.0 | 19,491.8 | 17,048.0 | 18,179.7 | 18,892.3 | 18,204.1 | 17,573.7 | 17,695.8 | 18,723.5 | 18,490.8 |
| 2020's | 17,958.3 |
| - = No Data Reported; -- = Not Applicable; NA = Not Available; W = Withheld to avoid disclosure of individual company data. |
| Release Date: 6/1/2022 |
| Next Release Date: TBD |