|
Download Data (XLS File) |
|
||||||||
|
||||||||
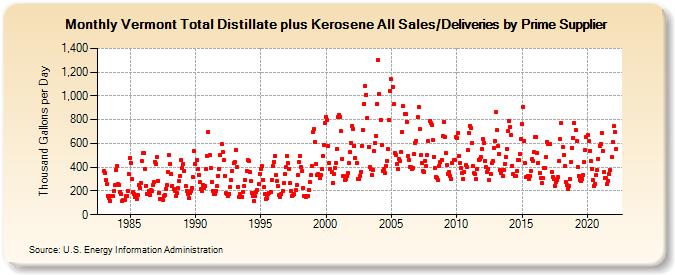
| Vermont Total Distillate plus Kerosene All Sales/Deliveries by Prime Supplier (Thousand Gallons per Day) | ||||||||
| Year | Jan | Feb | Mar | Apr | May | Jun | Jul | Aug | Sep | Oct | Nov | Dec |
|---|---|---|---|---|---|---|---|---|---|---|---|---|
| 1983 | 368.8 | 350.1 | 295.6 | 255.7 | 158.7 | 137.0 | 119.6 | 156.4 | 157.9 | 196.9 | 247.4 | 379.3 |
| 1984 | 412.1 | 256.7 | 253.8 | 195.2 | 171.7 | 118.4 | 122.4 | 124.7 | 155.5 | 160.6 | 202.1 | 345.9 |
| 1985 | 480.2 | 431.2 | 297.9 | 188.9 | 177.1 | 148.3 | 130.9 | 168.1 | 249.7 | 228.9 | 269.6 | 452.9 |
| 1986 | 518.4 | 518.4 | 382.8 | 244.2 | 177.1 | 197.6 | 164.5 | 204.8 | 200.9 | 253.4 | 272.1 | 445.6 |
| 1987 | 430.3 | 485.7 | 287.8 | 186.2 | 135.5 | 133.1 | 124.7 | 161.2 | 164.9 | 217.4 | 248.7 | 357.9 |
| 1988 | 504.3 | 430.0 | 340.9 | 245.3 | 214.5 | 198.4 | 153.4 | 183.5 | 223.5 | 283.1 | 327.1 | 456.6 |
| 1989 | 393.4 | 429.1 | 370.8 | 243.7 | 201.3 | 172.7 | 140.4 | 179.4 | 197.6 | 227.9 | 313.7 | 533.9 |
| 1990 | 428.5 | 459.1 | 382.2 | 334.0 | 271.9 | 214.4 | 200.4 | 251.4 | 225.2 | 237.7 | 382.2 | 497.1 |
| 1991 | 696.1 | 499.8 | 393.1 | 273.5 | 202.2 | 171.0 | 173.6 | 203.4 | 237.9 | 329.8 | 385.6 | 499.3 |
| 1992 | 591.3 | 524.6 | 458.9 | 330.0 | 179.7 | 173.2 | 159.1 | 177.0 | 232.4 | 289.5 | 370.6 | 434.2 |
| 1993 | 445.0 | 543.8 | 401.4 | 236.0 | 147.8 | 172.3 | 152.5 | 152.1 | 191.3 | 242.6 | 288.9 | 369.4 |
| 1994 | 456.5 | 453.2 | 356.4 | 279.7 | 185.0 | 154.7 | 118.1 | 153.9 | 193.3 | 209.6 | 255.5 | 343.9 |
| 1995 | 384.7 | 407.9 | 296.1 | 229.7 | 171.7 | 133.9 | 138.4 | 176.7 | 186.7 | 194.4 | 290.2 | 408.5 |
| 1996 | 447.5 | 494.0 | 336.2 | 283.5 | 237.5 | 165.2 | 151.7 | 172.1 | 200.6 | 267.0 | 342.5 | 398.0 |
| 1997 | 493.3 | 434.3 | 388.7 | 264.4 | 201.6 | 160.0 | 166.6 | 173.5 | 204.5 | 253.6 | 334.3 | 447.5 |
| 1998 | 494.1 | 401.8 | 368.2 | 226.7 | 156.1 | 157.9 | 149.9 | 159.4 | 204.3 | 274.7 | 331.2 | 408.5 |
| 1999 | 694.8 | 720.1 | 611.3 | 429.3 | 330.4 | 343.8 | 310.4 | 331.2 | 384.5 | 496.2 | 588.2 | 768.3 |
| 2000 | 824.6 | 799.7 | 579.0 | 435.0 | 387.6 | 356.7 | 266.6 | 342.1 | 392.1 | 439.1 | 554.6 | 819.7 |
| 2001 | 843.5 | 821.0 | 702.5 | 472.2 | 327.4 | 288.0 | 296.5 | 323.9 | 352.6 | 431.7 | 529.3 | 604.5 |
| 2002 | 748.1 | 722.4 | 580.6 | 476.1 | 433.6 | 302.3 | 303.0 | 326.1 | 360.9 | 581.3 | 716.3 | 935.1 |
| 2003 | 1,079.7 | 1,010.5 | 817.7 | 573.1 | 397.9 | 381.3 | 334.7 | 378.5 | 533.2 | 603.2 | 665.5 | 935.7 |
| 2004 | 1,300.9 | 1,016.2 | 799.4 | 591.0 | 369.9 | 387.5 | 349.3 | 414.1 | 455.7 | 551.5 | 798.9 | 1,039.5 |
| 2005 | 1,139.3 | 1,079.1 | 927.9 | 520.2 | 504.5 | 430.2 | 384.5 | 469.8 | 453.2 | 528.8 | 694.9 | 911.3 |
| 2006 | 847.8 | 847.5 | 782.5 | 492.1 | 461.2 | 404.6 | 402.3 | 387.4 | 393.0 | 507.1 | 607.0 | 624.5 |
| 2007 | 821.3 | 908.3 | 719.5 | 499.0 | 437.0 | 372.1 | 361.3 | 452.9 | 408.3 | 503.2 | 620.4 | 786.9 |
| 2008 | 769.4 | 752.5 | 631.6 | 488.9 | 396.6 | 320.8 | 310.0 | 290.7 | 414.0 | 440.2 | 463.0 | 659.6 |
| 2009 | 783.5 | 652.0 | 519.2 | 417.7 | 346.4 | 357.6 | 328.5 | 299.6 | 436.5 | 456.7 | 461.3 | 653.5 |
| 2010 | 642.8 | 686.3 | 496.6 | 431.1 | 389.8 | 350.9 | 302.3 | 359.7 | 416.1 | 401.8 | 544.3 | 685.9 |
| 2011 | 749.3 | 733.8 | 605.0 | 408.7 | 347.5 | 345.7 | 298.8 | 388.0 | 464.2 | 465.7 | 489.8 | 551.2 |
| 2012 | 634.5 | 607.3 | 453.7 | 398.8 | 359.3 | 382.8 | 289.6 | 345.6 | 433.3 | 449.2 | 563.2 | 624.1 |
| 2013 | 860.5 | 709.3 | 575.4 | 512.0 | 379.7 | 347.0 | 328.0 | 378.0 | 429.1 | 483.8 | 555.8 | 706.4 |
| 2014 | 790.9 | 741.7 | 675.1 | 413.8 | 342.5 | 324.1 | 327.0 | 368.2 | 458.0 | 463.6 | 510.7 | 640.4 |
| 2015 | 764.0 | 908.1 | 623.8 | 433.1 | 317.2 | 327.3 | 300.1 | 325.9 | 367.3 | 469.5 | 453.9 | 525.3 |
| 2016 | 654.7 | 653.7 | 522.2 | 437.6 | 353.6 | 305.6 | 263.9 | 305.5 | 392.6 | 391.3 | 482.1 | 614.2 |
| 2017 | 597.3 | 597.4 | 596.5 | 359.9 | 318.7 | 297.7 | 239.9 | 272.0 | 290.9 | 316.8 | 455.0 | 634.1 |
| 2018 | 771.8 | 571.3 | 500.8 | 410.8 | 279.3 | 252.8 | 219.9 | 241.6 | 297.6 | 445.2 | 564.4 | 648.6 |
| 2019 | 773.6 | 716.1 | 620.0 | 400.8 | 328.3 | 290.9 | 286.4 | 303.5 | 335.3 | 440.0 | 543.7 | 653.9 |
| 2020 | 667.9 | 616.3 | 540.5 | 452.0 | 387.6 | 289.4 | 241.5 | 259.3 | 337.2 | 373.6 | 471.2 | 580.8 |
| 2021 | 597.3 | 685.7 | 538.6 | 356.6 | 307.3 | 305.1 | 260.1 | 285.5 | 342.1 | 373.1 | 483.3 | 613.3 |
| 2022 | 743.3 | 692.5 | 553.6 | |||||||||
| - = No Data Reported; -- = Not Applicable; NA = Not Available; W = Withheld to avoid disclosure of individual company data. |
| Release Date: 5/19/2022 |
| Next Release Date: TBD |