|
Download Data (XLS File) |
|
||||||||
|
||||||||
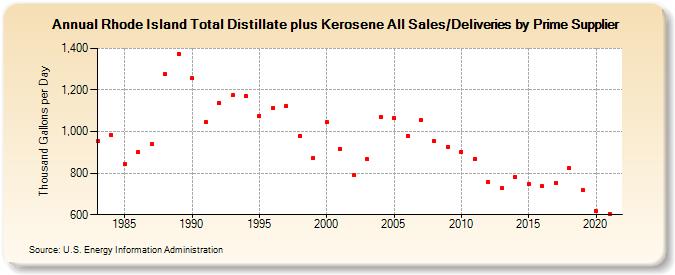
| Rhode Island Total Distillate plus Kerosene All Sales/Deliveries by Prime Supplier (Thousand Gallons per Day) | ||||||||
| Decade | Year-0 | Year-1 | Year-2 | Year-3 | Year-4 | Year-5 | Year-6 | Year-7 | Year-8 | Year-9 |
|---|---|---|---|---|---|---|---|---|---|---|
| 1980's | 953.7 | 982.6 | 843.1 | 901.5 | 937.9 | 1,274.9 | 1,372.8 | |||
| 1990's | 1,255.2 | 1,045.0 | 1,137.2 | 1,174.5 | 1,168.8 | 1,076.0 | 1,112.6 | 1,122.6 | 978.9 | 872.1 |
| 2000's | 1,044.0 | 918.4 | 789.8 | 866.4 | 1,069.5 | 1,064.4 | 980.1 | 1,053.7 | 953.6 | 926.9 |
| 2010's | 904.0 | 869.5 | 756.5 | 727.6 | 779.6 | 750.0 | 735.8 | 754.9 | 823.6 | 718.0 |
| 2020's | 617.2 |
| - = No Data Reported; -- = Not Applicable; NA = Not Available; W = Withheld to avoid disclosure of individual company data. |
| Release Date: 6/1/2022 |
| Next Release Date: TBD |