|
Download Data (XLS File) |
|
||||||||
|
||||||||
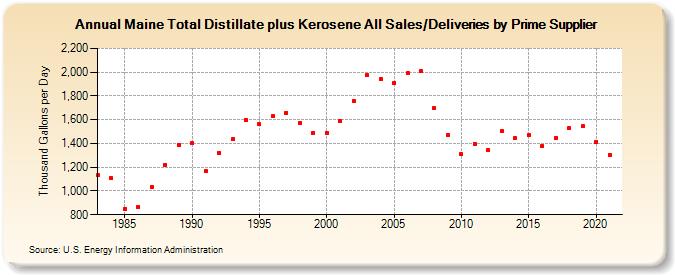
| Maine Total Distillate plus Kerosene All Sales/Deliveries by Prime Supplier (Thousand Gallons per Day) | ||||||||
| Decade | Year-0 | Year-1 | Year-2 | Year-3 | Year-4 | Year-5 | Year-6 | Year-7 | Year-8 | Year-9 |
|---|---|---|---|---|---|---|---|---|---|---|
| 1980's | 1,130.7 | 1,107.5 | 850.4 | 867.9 | 1,034.7 | 1,221.4 | 1,389.4 | |||
| 1990's | 1,403.6 | 1,167.1 | 1,322.5 | 1,434.3 | 1,601.4 | 1,560.8 | 1,630.6 | 1,659.8 | 1,574.7 | 1,489.4 |
| 2000's | 1,488.4 | 1,593.0 | 1,756.4 | 1,973.4 | 1,941.4 | 1,910.1 | 1,990.5 | 2,006.7 | 1,694.9 | 1,470.3 |
| 2010's | 1,307.0 | 1,396.9 | 1,341.5 | 1,505.5 | 1,442.9 | 1,471.5 | 1,378.8 | 1,443.7 | 1,526.7 | 1,543.9 |
| 2020's | 1,413.4 |
| - = No Data Reported; -- = Not Applicable; NA = Not Available; W = Withheld to avoid disclosure of individual company data. |
| Release Date: 6/1/2022 |
| Next Release Date: TBD |