|
Download Data (XLS File) |
|
||||||||
|
||||||||
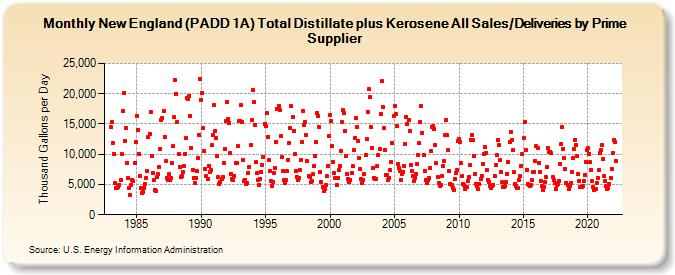
| New England (PADD 1A) Total Distillate plus Kerosene All Sales/Deliveries by Prime Supplier (Thousand Gallons per Day) | ||||||||
| Year | Jan | Feb | Mar | Apr | May | Jun | Jul | Aug | Sep | Oct | Nov | Dec |
|---|---|---|---|---|---|---|---|---|---|---|---|---|
| 1983 | 14,487.1 | 15,290.3 | 11,831.3 | 10,097.7 | 5,198.8 | 4,455.8 | 4,440.0 | 4,631.0 | 4,991.2 | 5,682.8 | 10,010.3 | 17,106.8 |
| 1984 | 20,095.5 | 12,192.2 | 14,388.2 | 8,628.7 | 6,081.2 | 4,413.6 | 3,269.9 | 4,898.7 | 5,752.2 | 5,514.7 | 8,549.7 | 12,027.5 |
| 1985 | 16,240.9 | 14,002.6 | 10,082.6 | 6,432.2 | 4,430.4 | 3,669.7 | 3,686.9 | 4,416.8 | 5,061.9 | 6,105.0 | 7,258.7 | 12,851.8 |
| 1986 | 13,268.9 | 16,938.0 | 9,740.4 | 6,896.3 | 5,665.7 | 4,137.2 | 3,918.7 | 6,181.9 | 6,669.1 | 7,891.9 | 10,938.5 | 15,680.2 |
| 1987 | 16,009.9 | 17,223.3 | 12,904.5 | 8,872.5 | 6,084.6 | 5,758.8 | 6,657.7 | 5,735.4 | 6,138.8 | 8,467.3 | 11,314.1 | 16,071.4 |
| 1988 | 22,302.5 | 20,021.9 | 15,336.7 | 10,027.6 | 7,942.8 | 6,261.9 | 6,430.9 | 7,017.8 | 7,991.3 | 10,085.8 | 12,724.1 | 19,337.8 |
| 1989 | 19,194.0 | 19,657.6 | 16,255.7 | 11,066.1 | 7,408.4 | 6,014.9 | 5,291.7 | 6,042.8 | 7,212.2 | 9,377.1 | 13,130.2 | 22,438.4 |
| 1990 | 18,936.8 | 20,194.6 | 14,332.8 | 10,535.2 | 7,599.2 | 6,472.7 | 5,928.3 | 8,134.1 | 6,999.6 | 7,402.4 | 11,484.3 | 13,107.2 |
| 1991 | 18,139.5 | 13,892.4 | 12,696.9 | 9,752.3 | 6,270.2 | 5,156.1 | 5,371.5 | 5,883.6 | 6,292.0 | 8,567.3 | 10,894.8 | 15,497.5 |
| 1992 | 18,593.1 | 15,770.7 | 15,195.1 | 10,215.4 | 6,789.3 | 5,943.3 | 5,771.8 | 6,480.6 | 8,487.9 | 8,604.7 | 11,307.6 | 15,482.8 |
| 1993 | 15,443.2 | 18,129.6 | 15,348.2 | 9,087.8 | 5,492.9 | 5,791.7 | 4,999.9 | 5,310.4 | 6,968.6 | 7,892.0 | 11,484.6 | 15,591.6 |
| 1994 | 20,622.8 | 18,597.4 | 14,782.0 | 8,699.4 | 6,823.7 | 5,758.6 | 4,882.8 | 5,981.7 | 7,116.1 | 8,217.8 | 9,568.1 | 14,996.4 |
| 1995 | 14,676.8 | 16,837.4 | 12,904.3 | 9,120.2 | 7,253.5 | 5,546.3 | 4,701.0 | 5,453.0 | 6,929.0 | 7,709.0 | 12,075.3 | 17,444.3 |
| 1996 | 18,014.2 | 17,264.8 | 13,030.8 | 9,566.9 | 7,303.3 | 5,673.5 | 5,226.4 | 5,663.8 | 7,197.2 | 8,984.7 | 11,889.3 | 14,394.5 |
| 1997 | 17,927.3 | 16,161.0 | 13,867.6 | 9,991.9 | 7,248.5 | 6,281.9 | 5,808.2 | 6,103.0 | 7,392.6 | 9,109.4 | 12,052.7 | 17,147.3 |
| 1998 | 14,910.8 | 15,358.3 | 13,158.2 | 8,867.3 | 6,370.3 | 6,313.7 | 5,345.8 | 5,510.4 | 6,681.1 | 7,970.7 | 9,716.4 | 12,013.0 |
| 1999 | 16,866.2 | 16,362.9 | 14,485.1 | 7,035.3 | 5,405.5 | 4,524.6 | 3,920.8 | 4,304.5 | 4,883.7 | 6,415.1 | 8,119.3 | 12,947.6 |
| 2000 | 16,496.2 | 15,523.6 | 11,343.5 | 8,736.3 | 6,880.5 | 5,996.3 | 4,900.9 | 6,087.3 | 7,420.7 | 8,036.1 | 10,534.5 | 15,266.6 |
| 2001 | 17,253.3 | 16,794.0 | 13,921.3 | 9,779.3 | 6,747.2 | 5,863.3 | 5,353.0 | 5,731.3 | 6,952.1 | 7,974.3 | 10,693.3 | 12,676.2 |
| 2002 | 16,027.6 | 14,471.9 | 12,187.1 | 9,432.0 | 7,571.5 | 5,847.4 | 5,251.0 | 5,757.8 | 6,663.5 | 9,950.8 | 12,562.9 | 17,050.6 |
| 2003 | 20,727.6 | 19,387.4 | 14,497.9 | 11,106.1 | 7,665.5 | 6,143.8 | 5,823.3 | 5,949.0 | 7,981.9 | 9,878.5 | 10,824.5 | 16,678.1 |
| 2004 | 22,074.5 | 17,740.1 | 14,352.4 | 10,716.3 | 6,537.4 | 6,596.8 | 5,717.8 | 6,149.8 | 7,378.4 | 8,750.1 | 11,794.6 | 16,318.4 |
| 2005 | 18,047.0 | 16,637.9 | 14,602.7 | 8,456.3 | 7,775.2 | 7,201.1 | 5,782.1 | 6,743.8 | 7,125.9 | 8,118.1 | 11,632.5 | 16,165.1 |
| 2006 | 14,948.7 | 15,582.5 | 13,884.6 | 8,203.7 | 7,301.6 | 6,376.2 | 5,548.3 | 6,112.4 | 6,789.9 | 8,365.3 | 9,865.5 | 11,875.1 |
| 2007 | 15,349.7 | 18,011.9 | 13,580.7 | 9,897.9 | 7,282.4 | 5,700.5 | 5,197.4 | 5,667.9 | 6,013.9 | 7,755.3 | 10,462.8 | 14,494.3 |
| 2008 | 14,608.7 | 14,199.5 | 11,580.5 | 8,486.4 | 6,178.6 | 5,220.4 | 4,816.8 | 4,915.2 | 6,381.7 | 8,062.6 | 8,823.3 | 13,170.0 |
| 2009 | 15,662.9 | 13,099.3 | 10,655.9 | 7,278.2 | 5,105.6 | 4,861.3 | 4,340.1 | 4,165.1 | 5,955.6 | 6,927.8 | 7,330.2 | 12,111.0 |
| 2010 | 12,537.1 | 12,084.6 | 8,519.6 | 6,407.9 | 5,152.2 | 4,891.4 | 4,316.4 | 4,656.7 | 5,580.0 | 6,239.3 | 8,172.6 | 12,400.1 |
| 2011 | 13,124.8 | 12,381.0 | 9,747.2 | 6,781.0 | 5,156.9 | 4,823.7 | 4,267.0 | 5,133.5 | 5,980.6 | 6,431.1 | 8,428.1 | 10,007.6 |
| 2012 | 11,202.5 | 10,192.3 | 7,465.7 | 5,803.0 | 5,421.9 | 4,800.9 | 4,361.1 | 4,819.1 | 4,989.6 | 6,394.0 | 8,166.7 | 9,801.1 |
| 2013 | 12,362.3 | 11,582.1 | 8,967.7 | 7,083.6 | 5,358.2 | 4,555.3 | 4,567.5 | 4,734.9 | 5,447.0 | 6,776.6 | 8,794.4 | 11,997.6 |
| 2014 | 13,659.8 | 12,388.9 | 10,641.8 | 6,997.0 | 5,116.6 | 4,676.1 | 4,479.8 | 4,451.2 | 5,766.1 | 6,329.7 | 8,046.4 | 9,954.5 |
| 2015 | 12,606.4 | 15,255.6 | 10,641.8 | 7,459.9 | 5,111.1 | 4,972.6 | 4,674.6 | 4,961.0 | 5,722.1 | 6,997.6 | 7,136.8 | 8,890.8 |
| 2016 | 11,299.4 | 11,104.4 | 8,516.8 | 6,999.2 | 5,640.2 | 4,793.0 | 4,157.3 | 4,652.0 | 5,333.8 | 6,197.1 | 7,862.8 | 10,992.0 |
| 2017 | 10,344.0 | 10,434.9 | 10,131.2 | 6,247.0 | 5,674.6 | 5,230.4 | 4,235.4 | 4,974.4 | 5,118.6 | 5,624.0 | 8,324.6 | 11,749.0 |
| 2018 | 14,434.1 | 10,825.6 | 9,301.1 | 7,492.5 | 5,314.6 | 4,953.7 | 4,209.9 | 4,680.2 | 5,192.8 | 7,142.8 | 9,335.1 | 10,800.2 |
| 2019 | 12,421.8 | 11,536.4 | 9,722.5 | 6,787.1 | 5,574.0 | 4,628.7 | 4,654.8 | 4,721.3 | 5,540.6 | 6,492.8 | 8,783.4 | 10,726.6 |
| 2020 | 11,045.2 | 10,114.6 | 8,646.8 | 7,451.9 | 5,597.5 | 4,611.3 | 4,089.1 | 4,301.4 | 5,300.8 | 6,055.8 | 7,355.1 | 10,209.1 |
| 2021 | 10,707.6 | 11,577.0 | 9,271.4 | 6,386.8 | 5,531.3 | 4,695.3 | 4,273.4 | 4,452.3 | 5,026.3 | 6,034.8 | 7,491.0 | 10,126.9 |
| 2022 | 12,366.8 | 12,052.0 | 8,879.9 | |||||||||
| - = No Data Reported; -- = Not Applicable; NA = Not Available; W = Withheld to avoid disclosure of individual company data. |
| Release Date: 5/19/2022 |
| Next Release Date: TBD |