|
Download Data (XLS File) |
|
||||||||
|
||||||||
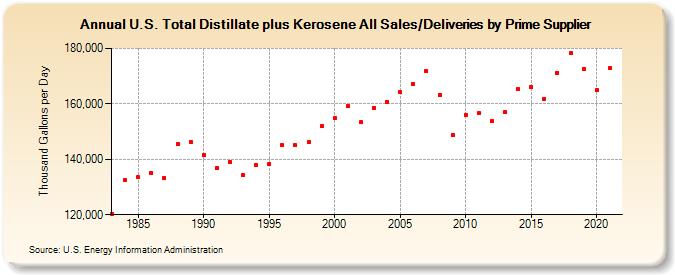
| U.S. Total Distillate plus Kerosene All Sales/Deliveries by Prime Supplier (Thousand Gallons per Day) | ||||||||
| Decade | Year-0 | Year-1 | Year-2 | Year-3 | Year-4 | Year-5 | Year-6 | Year-7 | Year-8 | Year-9 |
|---|---|---|---|---|---|---|---|---|---|---|
| 1980's | 120,270.2 | 132,383.5 | 133,510.8 | 134,970.4 | 133,342.8 | 145,548.2 | 146,392.0 | |||
| 1990's | 141,385.2 | 136,898.2 | 139,149.1 | 134,231.4 | 137,929.4 | 138,273.2 | 145,047.6 | 145,037.9 | 146,126.0 | 151,943.2 |
| 2000's | 154,968.6 | 159,341.8 | 153,335.3 | 158,533.6 | 160,716.2 | 164,089.1 | 167,272.3 | 171,774.3 | 163,243.5 | 148,685.3 |
| 2010's | 156,067.4 | 156,560.9 | 153,717.7 | 156,971.6 | 165,439.1 | 166,070.6 | 161,861.1 | 171,225.5 | 178,275.2 | 172,590.4 |
| 2020's | 165,101.4 |
| - = No Data Reported; -- = Not Applicable; NA = Not Available; W = Withheld to avoid disclosure of individual company data. |
| Release Date: 6/1/2022 |
| Next Release Date: TBD |