|
Download Data (XLS File) |
|
||||||||
|
||||||||
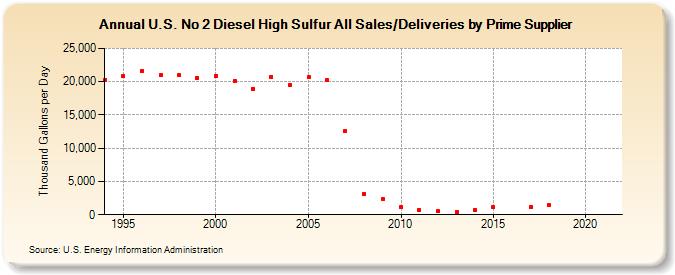
| U.S. No 2 Diesel High Sulfur All Sales/Deliveries by Prime Supplier (Thousand Gallons per Day) | ||||||||
| Decade | Year-0 | Year-1 | Year-2 | Year-3 | Year-4 | Year-5 | Year-6 | Year-7 | Year-8 | Year-9 |
|---|---|---|---|---|---|---|---|---|---|---|
| 1990's | 20,270.6 | 20,832.1 | 21,623.3 | 20,935.2 | 20,976.7 | 20,623.7 | ||||
| 2000's | 20,856.6 | 20,102.6 | 18,961.1 | 20,772.5 | 19,525.9 | 20,664.8 | 20,231.1 | 12,604.1 | 3,182.2 | 2,375.4 |
| 2010's | 1,155.4 | 704.7 | 500.9 | 390.5 | 705.4 | 1,114.4 | W | 1,183.2 | 1,391.7 | W |
| 2020's | W |
| - = No Data Reported; -- = Not Applicable; NA = Not Available; W = Withheld to avoid disclosure of individual company data. |
| Release Date: 6/1/2022 |
| Next Release Date: TBD |