|
Download Data (XLS File) |
|
||||||||
|
||||||||
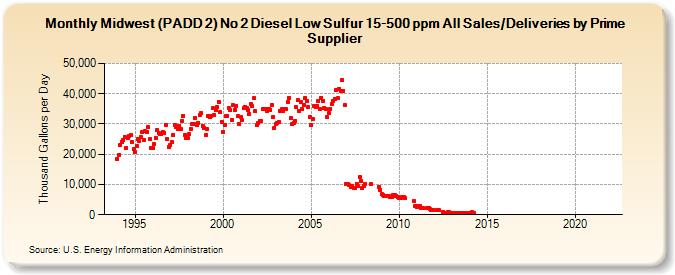
| Midwest (PADD 2) No 2 Diesel Low Sulfur 15-500 ppm All Sales/Deliveries by Prime Supplier (Thousand Gallons per Day) | ||||||||
| Year | Jan | Feb | Mar | Apr | May | Jun | Jul | Aug | Sep | Oct | Nov | Dec |
|---|---|---|---|---|---|---|---|---|---|---|---|---|
| 1993 | NA | NA | NA | |||||||||
| 1994 | 18,465.9 | 19,829.8 | 23,006.7 | 24,166.3 | 24,802.2 | 25,817.5 | 22,202.7 | 25,523.4 | 26,122.6 | 26,223.1 | 24,038.8 | 21,714.0 |
| 1995 | 20,815.2 | 22,637.6 | 25,036.0 | 24,451.2 | 25,776.3 | 27,327.7 | 24,726.8 | 27,522.6 | 27,313.6 | 29,017.5 | 24,986.7 | 22,062.9 |
| 1996 | 21,937.4 | 23,346.9 | 25,285.1 | 27,970.1 | 27,150.0 | 26,841.8 | 26,578.0 | 27,338.4 | 26,966.5 | 29,804.5 | 24,895.3 | 22,228.1 |
| 1997 | 22,993.0 | 23,983.8 | 26,456.6 | 29,584.4 | 28,897.5 | 28,495.5 | 29,420.0 | 28,317.1 | 31,044.5 | 32,694.7 | 26,218.9 | 25,312.2 |
| 1998 | 25,386.3 | 26,676.3 | 28,481.7 | 29,949.4 | 30,040.5 | 32,123.7 | 29,703.2 | 30,405.3 | 33,070.6 | 33,634.5 | 29,385.2 | 28,728.3 |
| 1999 | 26,211.1 | 28,324.4 | 32,493.7 | 32,447.2 | 32,664.4 | 35,131.4 | 33,032.9 | 34,550.7 | 35,619.6 | 37,286.8 | 33,817.5 | 30,802.4 |
| 2000 | 27,473.5 | 29,824.8 | 32,485.1 | 32,676.1 | 35,351.4 | 34,548.4 | 31,397.7 | 36,168.5 | 34,778.7 | 36,012.8 | 32,596.5 | 30,082.8 |
| 2001 | 32,454.7 | 31,192.9 | 35,142.9 | 35,761.0 | 35,150.1 | 34,747.8 | 33,360.0 | 36,526.7 | 35,851.3 | 38,432.3 | 34,169.1 | 29,553.9 |
| 2002 | 30,183.3 | 30,846.6 | 31,040.2 | 34,833.1 | 34,958.5 | 34,808.9 | 34,217.6 | 35,043.3 | 34,658.0 | 36,336.7 | 32,288.6 | 28,790.8 |
| 2003 | 30,089.1 | 30,322.5 | 30,576.9 | 34,445.2 | 34,830.2 | 34,352.2 | 34,950.9 | 34,946.9 | 37,411.4 | 38,692.9 | 31,904.5 | 29,878.7 |
| 2004 | 30,381.2 | 31,050.9 | 35,477.2 | 37,839.0 | 34,135.4 | 37,255.1 | 34,800.4 | 36,312.7 | 38,729.3 | 37,484.0 | 35,484.3 | 32,370.3 |
| 2005 | 29,544.3 | 31,762.9 | 35,950.7 | 35,598.5 | 35,903.4 | 37,462.2 | 34,801.2 | 38,705.8 | 37,522.5 | 35,238.6 | 34,899.3 | 32,218.8 |
| 2006 | 33,674.6 | 35,100.1 | 36,668.1 | 37,527.6 | 38,413.6 | 41,204.7 | 38,498.5 | 41,651.4 | 40,784.9 | 44,516.2 | 41,066.4 | 36,122.6 |
| 2007 | 10,208.1 | 10,138.5 | 9,691.0 | 9,270.7 | 9,596.1 | 8,940.6 | 8,978.1 | 10,256.8 | 9,629.6 | 12,316.0 | 11,092.7 | 8,753.0 |
| 2008 | 9,622.0 | 10,150.2 | W | W | W | 10,048.4 | W | W | W | W | 9,182.2 | 8,243.5 |
| 2009 | 6,822.0 | 6,519.4 | 6,342.6 | 6,145.4 | W | 6,187.2 | 5,929.5 | 6,015.5 | 6,443.3 | 6,361.1 | 6,147.5 | 5,841.4 |
| 2010 | 5,473.3 | 5,404.3 | 5,818.0 | 5,879.7 | 5,432.5 | W | W | W | W | W | 4,527.2 | 2,788.8 |
| 2011 | 2,514.4 | 2,791.1 | 2,875.4 | 2,357.2 | 2,319.7 | W | W | 2,222.5 | 2,209.0 | 1,791.6 | 1,566.2 | 1,641.7 |
| 2012 | W | W | 1,517.2 | 1,443.3 | W | W | 962.3 | 700.5 | 657.5 | 842.4 | 776.6 | 692.1 |
| 2013 | 624.4 | 655.4 | 639.0 | 633.3 | 620.6 | 635.9 | 645.9 | 651.7 | 606.4 | 659.4 | 673.7 | 719.4 |
| 2014 | 704.6 | 716.0 | 735.8 | 711.6 | W | W | W | W | W | - | - | W |
| 2015 | W | W | W | W | W | W | W | W | W | W | W | W |
| 2016 | W | W | W | W | W | W | W | W | W | - | - | - |
| 2017 | - | - | - | - | - | - | - | - | - | - | - | - |
| 2018 | - | - | - | - | - | - | - | - | - | - | - | - |
| 2019 | - | - | - | - | - | - | - | - | - | - | - | - |
| 2020 | - | - | - | - | - | - | W | W | W | W | W | W |
| 2021 | W | W | W | W | W | W | W | W | W | W | W | W |
| 2022 | W | W | W | |||||||||
| - = No Data Reported; -- = Not Applicable; NA = Not Available; W = Withheld to avoid disclosure of individual company data. |
| Release Date: 5/19/2022 |
| Next Release Date: TBD |