|
Download Data (XLS File) |
|
||||||||
|
||||||||
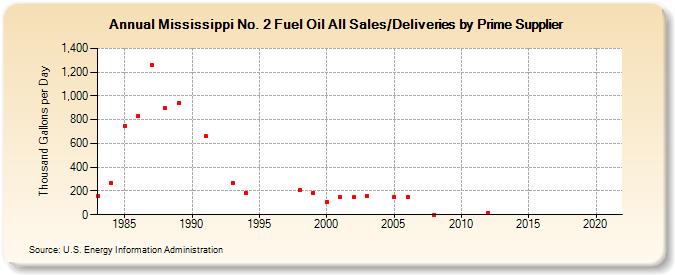
| Mississippi No. 2 Fuel Oil All Sales/Deliveries by Prime Supplier (Thousand Gallons per Day) | ||||||||
| Decade | Year-0 | Year-1 | Year-2 | Year-3 | Year-4 | Year-5 | Year-6 | Year-7 | Year-8 | Year-9 |
|---|---|---|---|---|---|---|---|---|---|---|
| 1980's | 153.7 | 268.5 | 746.8 | 832.1 | 1,264.0 | 894.6 | 944.2 | |||
| 1990's | W | 658.4 | W | 269.5 | 186.1 | W | W | W | 205.8 | 184.1 |
| 2000's | 110.3 | 145.5 | 146.0 | 159.4 | W | 146.2 | 150.4 | W | 1.7 | W |
| 2010's | W | W | 15.4 | W | W | W | W | W | W | W |
| 2020's | W |
| - = No Data Reported; -- = Not Applicable; NA = Not Available; W = Withheld to avoid disclosure of individual company data. |
| Release Date: 6/1/2022 |
| Next Release Date: TBD |