|
Download Data (XLS File) |
|
||||||||
|
||||||||
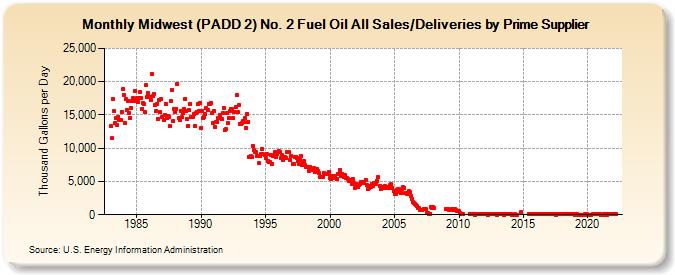
| Midwest (PADD 2) No. 2 Fuel Oil All Sales/Deliveries by Prime Supplier (Thousand Gallons per Day) | ||||||||
| Year | Jan | Feb | Mar | Apr | May | Jun | Jul | Aug | Sep | Oct | Nov | Dec |
|---|---|---|---|---|---|---|---|---|---|---|---|---|
| 1983 | 13,309.1 | 11,515.3 | 17,420.3 | 15,525.2 | 13,763.2 | 14,600.7 | 13,545.9 | 14,740.8 | 14,285.6 | 14,219.9 | 15,485.7 | 18,827.7 |
| 1984 | 18,054.8 | 13,813.0 | 17,388.9 | 15,723.9 | 17,165.1 | 15,336.4 | 14,520.8 | 16,111.3 | 17,104.5 | 17,468.7 | 18,582.8 | 17,166.0 |
| 1985 | 17,530.1 | 16,921.7 | 17,594.5 | 18,378.1 | 17,528.5 | 15,917.4 | 16,730.3 | 16,647.1 | 15,470.7 | 19,431.7 | 17,634.3 | 18,238.6 |
| 1986 | 17,663.3 | 17,182.4 | 21,202.0 | 17,777.8 | 18,219.2 | 16,428.5 | 15,586.7 | 16,707.7 | 14,439.5 | 17,211.7 | 15,365.9 | 17,386.0 |
| 1987 | 14,672.3 | 14,163.9 | 15,058.0 | 16,704.7 | 14,588.0 | 14,829.8 | 14,645.2 | 13,365.5 | 17,050.3 | 18,771.9 | 14,045.5 | 15,916.5 |
| 1988 | 15,479.5 | 15,910.4 | 19,667.3 | 14,504.0 | 14,300.1 | 15,630.0 | 14,624.8 | 15,308.9 | 15,891.6 | 17,343.8 | 15,579.0 | 14,391.8 |
| 1989 | 13,359.3 | 15,670.3 | 16,688.0 | 14,754.7 | 14,753.8 | 15,130.7 | 13,317.4 | 15,259.4 | 15,418.3 | 16,569.4 | 15,605.9 | 16,775.1 |
| 1990 | 13,106.5 | 15,597.9 | 14,535.0 | 14,761.8 | 15,098.1 | 16,025.3 | 15,675.6 | 16,631.2 | 16,586.6 | 16,837.2 | 15,285.0 | 13,720.6 |
| 1991 | 15,577.7 | 13,124.8 | 13,960.5 | 13,970.2 | 14,580.6 | 14,571.4 | 14,950.6 | 14,326.4 | 15,270.9 | 16,055.6 | 12,719.2 | 12,847.7 |
| 1992 | 15,331.5 | 13,718.7 | 14,572.7 | 15,649.0 | 15,948.4 | 15,941.3 | 14,534.4 | 15,513.1 | 16,197.2 | 17,944.6 | 15,416.3 | 16,420.0 |
| 1993 | 13,649.8 | 13,706.5 | 13,798.8 | 14,016.1 | 13,880.0 | 14,598.4 | 13,107.4 | 15,120.1 | 13,973.5 | 8,727.2 | 8,864.6 | 8,695.4 |
| 1994 | 10,308.2 | 9,747.9 | 9,418.5 | 9,402.4 | 8,835.3 | 8,900.4 | 7,710.1 | 8,859.7 | 9,165.3 | 9,933.3 | 9,080.8 | 8,983.6 |
| 1995 | 8,585.4 | 9,054.5 | 8,141.9 | 7,949.9 | 7,906.9 | 9,041.6 | 7,655.7 | 8,844.6 | 8,768.3 | 9,448.1 | 8,741.0 | 9,122.1 |
| 1996 | 9,563.6 | 9,468.1 | 8,496.1 | 8,909.1 | 8,161.7 | 8,651.1 | 8,634.2 | 8,481.2 | 9,370.7 | 9,467.6 | 9,378.5 | 8,240.3 |
| 1997 | 8,841.8 | 7,638.7 | 7,696.5 | 8,657.6 | 8,646.3 | 8,478.4 | 8,129.2 | 7,557.9 | 8,166.6 | 8,767.2 | 7,418.2 | 7,955.7 |
| 1998 | 8,071.7 | 7,416.7 | 7,200.0 | 7,111.8 | 6,564.5 | 7,112.5 | 6,827.0 | 6,729.1 | 6,862.3 | 7,016.2 | 6,403.5 | 6,552.5 |
| 1999 | 6,855.2 | 6,509.4 | 6,268.1 | 5,678.1 | 5,679.7 | 5,644.8 | 6,206.7 | 6,160.5 | 6,048.6 | 6,189.8 | 6,065.9 | 6,452.5 |
| 2000 | 5,571.7 | 5,375.1 | 5,771.0 | 5,592.8 | 5,852.4 | 5,709.2 | 5,296.6 | 6,150.2 | 6,152.3 | 6,687.3 | 5,845.2 | 6,190.5 |
| 2001 | 6,008.1 | 5,720.4 | 5,921.5 | 5,542.3 | 5,541.6 | 5,328.2 | 5,065.0 | 5,204.2 | 4,676.9 | 5,422.9 | 4,750.5 | 3,970.3 |
| 2002 | 4,549.4 | 4,248.2 | 4,178.7 | 4,533.3 | 4,543.7 | 4,900.4 | 4,910.7 | 4,854.0 | 4,834.7 | 5,219.4 | 4,392.7 | 3,854.9 |
| 2003 | 4,025.0 | 4,385.1 | 4,138.4 | 4,603.8 | 4,366.0 | 4,804.1 | 4,710.2 | 4,620.6 | 5,059.9 | 5,623.3 | 4,248.9 | 3,836.4 |
| 2004 | 4,162.7 | 4,038.2 | 3,977.1 | 4,374.0 | 3,961.3 | 4,234.3 | 3,959.3 | 4,100.9 | 4,402.9 | 4,610.2 | 4,057.4 | 3,502.6 |
| 2005 | 3,130.9 | 3,146.4 | 3,642.5 | 3,794.8 | 3,616.6 | 3,444.1 | 3,211.7 | 3,810.4 | 4,116.3 | 4,071.4 | 3,326.9 | 3,226.2 |
| 2006 | 3,150.7 | 3,492.4 | 3,351.4 | 2,845.5 | 2,294.6 | 1,922.8 | 1,694.3 | 1,653.1 | 1,418.5 | 1,250.4 | 1,055.5 | 958.8 |
| 2007 | 694.9 | 643.1 | 772.7 | 885.4 | 895.7 | 902.3 | 261.1 | 189.9 | 151.4 | 113.3 | 1,220.4 | 1,078.3 |
| 2008 | 1,090.6 | 994.3 | W | W | W | W | W | W | W | W | W | W |
| 2009 | 898.7 | 887.0 | 834.7 | 774.7 | W | 813.2 | 759.1 | 717.0 | 786.1 | 769.0 | 628.5 | 564.1 |
| 2010 | 496.9 | 276.1 | 87.7 | 131.8 | 128.4 | NA | NA | NA | NA | NA | 141.9 | 131.8 |
| 2011 | 130.6 | 134.6 | 172.6 | 28.9 | 36.9 | W | W | 40.9 | 54.0 | 62.2 | 53.7 | 34.8 |
| 2012 | 33.9 | 75.4 | 33.9 | 29.0 | 37.7 | W | 33.3 | 36.4 | 41.7 | 40.9 | 36.9 | 28.2 |
| 2013 | 40.8 | 38.3 | 44.2 | 52.1 | 71.1 | 56.3 | 23.7 | 34.5 | 35.6 | 48.1 | 64.0 | 42.3 |
| 2014 | 38.2 | 28.0 | 27.3 | 24.5 | 33.9 | W | 16.3 | W | W | W | 473.6 | W |
| 2015 | W | W | W | W | W | 141.1 | 57.4 | 75.1 | 79.1 | 80.2 | 63.8 | 80.5 |
| 2016 | 83.3 | 76.2 | 52.4 | 59.6 | 66.3 | 74.4 | 62.7 | 61.6 | 44.6 | 61.3 | 58.8 | 58.5 |
| 2017 | 55.8 | 33.6 | 37.7 | 53.1 | 58.5 | 40.4 | 24.3 | 33.7 | 43.2 | 74.2 | 162.8 | 93.5 |
| 2018 | 174.1 | 95.9 | 55.0 | 50.0 | 68.5 | 41.0 | 41.5 | 36.1 | 35.3 | 50.5 | 64.8 | 50.2 |
| 2019 | 24.2 | 26.1 | 32.4 | 17.4 | 19.2 | W | 25.3 | 24.7 | 27.3 | 42.6 | 59.7 | 37.6 |
| 2020 | 28.0 | 29.0 | 31.5 | 28.0 | W | 40.2 | 36.6 | 41.2 | 41.6 | 66.8 | 41.0 | 33.8 |
| 2021 | 24.9 | 32.2 | 19.2 | 40.1 | 44.6 | 36.1 | 31.5 | 40.5 | 54.4 | 74.8 | 78.2 | 82.8 |
| 2022 | 51.2 | 58.3 | 65.2 | |||||||||
| - = No Data Reported; -- = Not Applicable; NA = Not Available; W = Withheld to avoid disclosure of individual company data. |
| Release Date: 5/19/2022 |
| Next Release Date: TBD |