|
Download Data (XLS File) |
|
||||||||
|
||||||||
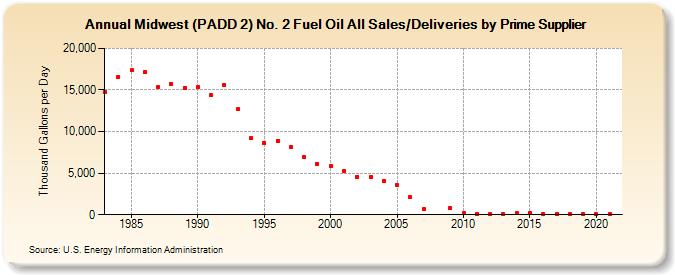
| Midwest (PADD 2) No. 2 Fuel Oil All Sales/Deliveries by Prime Supplier (Thousand Gallons per Day) | ||||||||
| Decade | Year-0 | Year-1 | Year-2 | Year-3 | Year-4 | Year-5 | Year-6 | Year-7 | Year-8 | Year-9 |
|---|---|---|---|---|---|---|---|---|---|---|
| 1980's | 14,794.5 | 16,549.6 | 17,344.0 | 17,108.9 | 15,323.4 | 15,721.7 | 15,272.5 | |||
| 1990's | 15,315.7 | 14,341.7 | 15,649.8 | 12,667.7 | 9,191.6 | 8,601.1 | 8,896.9 | 8,167.0 | 6,986.8 | 6,146.8 |
| 2000's | 5,852.4 | 5,261.0 | 4,586.9 | 4,534.8 | 4,113.8 | 3,546.8 | 2,082.2 | 649.2 | W | 766.7 |
| 2010's | 191.7 | 70.5 | 38.1 | 45.9 | 181.6 | 232.3 | 63.3 | 59.3 | 63.5 | 30.0 |
| 2020's | 38.0 |
| - = No Data Reported; -- = Not Applicable; NA = Not Available; W = Withheld to avoid disclosure of individual company data. |
| Release Date: 6/1/2022 |
| Next Release Date: TBD |