|
Download Data (XLS File) |
|
||||||||
|
||||||||
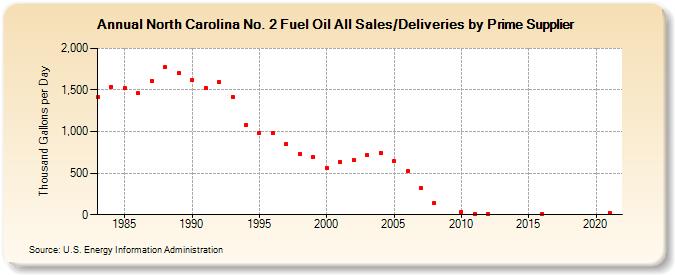
| North Carolina No. 2 Fuel Oil All Sales/Deliveries by Prime Supplier (Thousand Gallons per Day) | ||||||||
| Decade | Year-0 | Year-1 | Year-2 | Year-3 | Year-4 | Year-5 | Year-6 | Year-7 | Year-8 | Year-9 |
|---|---|---|---|---|---|---|---|---|---|---|
| 1980's | 1,417.1 | 1,540.3 | 1,518.2 | 1,458.7 | 1,612.7 | 1,775.3 | 1,698.7 | |||
| 1990's | 1,614.9 | 1,525.5 | 1,597.7 | 1,416.0 | 1,076.3 | 986.6 | 977.2 | 852.3 | 733.6 | 690.5 |
| 2000's | 565.9 | 638.9 | 663.8 | 714.1 | 747.5 | 640.8 | 520.9 | 320.3 | 143.7 | W |
| 2010's | 35.3 | 5.9 | 7.7 | W | W | W | 12.8 | W | W | W |
| 2020's | W |
| - = No Data Reported; -- = Not Applicable; NA = Not Available; W = Withheld to avoid disclosure of individual company data. |
| Release Date: 6/1/2022 |
| Next Release Date: TBD |