|
Download Data (XLS File) |
|
||||||||
|
||||||||
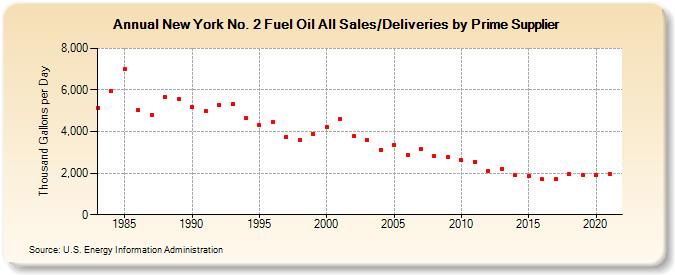
| New York No. 2 Fuel Oil All Sales/Deliveries by Prime Supplier (Thousand Gallons per Day) | ||||||||
| Decade | Year-0 | Year-1 | Year-2 | Year-3 | Year-4 | Year-5 | Year-6 | Year-7 | Year-8 | Year-9 |
|---|---|---|---|---|---|---|---|---|---|---|
| 1980's | 5,151.6 | 5,956.3 | 6,989.1 | 5,027.4 | 4,812.3 | 5,664.8 | 5,577.6 | |||
| 1990's | 5,167.0 | 4,991.1 | 5,285.7 | 5,324.2 | 4,656.3 | 4,314.6 | 4,467.0 | 3,754.0 | 3,582.3 | 3,894.3 |
| 2000's | 4,206.0 | 4,591.0 | 3,773.2 | 3,589.9 | 3,103.1 | 3,357.7 | 2,879.1 | 3,153.1 | 2,811.8 | 2,783.8 |
| 2010's | 2,609.2 | 2,553.7 | 2,104.8 | 2,216.5 | 1,894.3 | 1,848.8 | 1,700.3 | 1,720.5 | 1,968.0 | 1,915.7 |
| 2020's | 1,905.9 |
| - = No Data Reported; -- = Not Applicable; NA = Not Available; W = Withheld to avoid disclosure of individual company data. |
| Release Date: 6/1/2022 |
| Next Release Date: TBD |