|
Download Data (XLS File) |
|
||||||||
|
||||||||
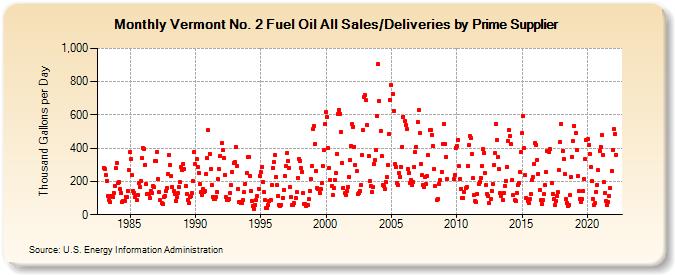
| Vermont No. 2 Fuel Oil All Sales/Deliveries by Prime Supplier (Thousand Gallons per Day) | ||||||||
| Year | Jan | Feb | Mar | Apr | May | Jun | Jul | Aug | Sep | Oct | Nov | Dec |
|---|---|---|---|---|---|---|---|---|---|---|---|---|
| 1983 | 282.1 | 275.7 | 238.1 | 204.9 | 111.4 | 86.7 | 74.2 | 110.9 | 104.9 | 133.0 | 175.6 | 281.1 |
| 1984 | 312.5 | 189.6 | 194.5 | 152.5 | 131.4 | 78.1 | 81.6 | 83.3 | 107.3 | 103.6 | 141.4 | 270.2 |
| 1985 | 378.2 | 336.9 | 237.3 | 140.9 | 133.2 | 106.8 | 88.0 | 121.1 | 188.5 | 167.3 | 201.6 | 342.0 |
| 1986 | 399.2 | 397.9 | 299.0 | 182.3 | 122.2 | 126.9 | 101.8 | 144.0 | 131.9 | 172.5 | 163.8 | 321.0 |
| 1987 | 322.4 | 378.7 | 212.8 | 135.0 | 86.8 | 69.6 | 63.4 | 106.4 | 111.6 | 141.9 | 160.5 | 245.2 |
| 1988 | 361.2 | 300.1 | 231.1 | 165.5 | 141.6 | 123.4 | 83.3 | 104.0 | 127.6 | 165.5 | 196.1 | 284.3 |
| 1989 | 266.5 | 305.9 | 272.8 | 171.6 | 125.6 | 89.9 | 69.7 | 103.8 | 114.7 | 131.0 | 200.3 | 379.9 |
| 1990 | 303.1 | 332.0 | 289.8 | 252.6 | 183.1 | 134.6 | 120.4 | 155.3 | 139.2 | 140.9 | 245.3 | 340.4 |
| 1991 | 506.4 | 367.0 | 272.1 | 179.6 | 108.1 | 91.8 | 94.6 | 109.2 | 137.5 | 211.9 | 272.3 | 353.6 |
| 1992 | 430.1 | 386.2 | 342.3 | 241.4 | 105.8 | 90.0 | 86.5 | 93.5 | 132.3 | 176.8 | 256.8 | 310.6 |
| 1993 | 315.4 | 410.0 | 295.4 | 156.7 | 73.7 | 74.1 | 69.8 | 69.3 | 89.8 | 133.7 | 187.6 | 248.3 |
| 1994 | 347.8 | 345.8 | 232.4 | 141.3 | 83.2 | 50.1 | 34.8 | 60.8 | 88.2 | 111.5 | 156.6 | 231.6 |
| 1995 | 256.1 | 287.1 | 195.9 | 137.4 | 88.4 | 39.1 | 41.4 | 57.7 | 84.8 | 88.9 | 179.6 | 282.5 |
| 1996 | 318.4 | 360.2 | 225.6 | 179.4 | 113.1 | 57.1 | 53.4 | 60.8 | 101.4 | 151.2 | 234.4 | 291.0 |
| 1997 | 371.3 | 324.7 | 282.4 | 166.9 | 104.6 | 60.1 | 59.3 | 68.3 | 102.3 | 136.0 | 223.0 | 335.7 |
| 1998 | 325.4 | 282.1 | 259.0 | 129.7 | 66.1 | 63.7 | 50.1 | 60.3 | 93.6 | 145.3 | 214.1 | 292.6 |
| 1999 | 514.4 | 533.5 | 427.2 | 263.4 | 160.5 | 151.9 | 133.0 | 153.6 | 187.8 | 293.3 | 387.0 | 544.4 |
| 2000 | 618.7 | 588.0 | 399.9 | 280.9 | 208.7 | 172.3 | 121.4 | 160.4 | 208.5 | 248.0 | 367.1 | 606.1 |
| 2001 | 629.6 | 606.6 | 498.3 | 311.3 | 163.2 | 127.7 | 120.5 | 142.9 | 166.8 | 228.5 | 331.5 | 414.8 |
| 2002 | 545.1 | 529.1 | 408.8 | 297.4 | 260.7 | 122.0 | 132.3 | 145.4 | 178.1 | 359.0 | 506.9 | 706.2 |
| 2003 | 719.2 | 688.0 | 539.2 | 352.9 | 200.6 | 172.6 | 139.0 | 167.0 | 303.4 | 331.9 | 387.4 | 591.1 |
| 2004 | 903.2 | 682.9 | 506.1 | 351.5 | 177.9 | 170.6 | 157.1 | 194.4 | 228.0 | 301.8 | 487.7 | 690.2 |
| 2005 | 777.9 | 726.0 | 624.9 | 302.4 | 284.7 | 191.3 | 177.8 | 250.9 | 226.7 | 288.5 | 409.9 | 589.1 |
| 2006 | 561.8 | 536.7 | 514.6 | 274.0 | 250.2 | 192.1 | 209.6 | 177.9 | 197.3 | 288.1 | 376.0 | 409.4 |
| 2007 | 558.0 | 626.7 | 492.7 | 307.7 | 236.5 | 178.6 | 166.2 | 225.1 | 181.7 | 231.7 | 359.0 | 507.9 |
| 2008 | 509.3 | 481.8 | 414.4 | 273.9 | 171.0 | W | 87.6 | 93.6 | 184.1 | 206.0 | 259.0 | 425.4 |
| 2009 | 542.8 | 426.3 | 348.0 | 215.4 | W | W | W | W | W | 212.9 | 240.1 | 403.5 |
| 2010 | 414.1 | 450.3 | 290.2 | 215.6 | 156.6 | 102.6 | 99.7 | 138.9 | 158.6 | 169.0 | 292.5 | 416.6 |
| 2011 | 472.2 | 459.4 | 365.4 | 218.9 | 118.5 | 83.7 | 74.9 | 126.6 | 183.9 | 197.4 | 220.5 | 293.1 |
| 2012 | 392.7 | 371.4 | 251.9 | 180.1 | 125.4 | 112.8 | 68.9 | 93.8 | 143.6 | 186.1 | 298.1 | 370.9 |
| 2013 | 548.0 | 450.3 | 349.4 | 274.8 | 130.5 | 115.4 | 91.1 | 130.8 | 174.5 | 204.6 | 285.8 | 445.1 |
| 2014 | 507.6 | 473.9 | 422.2 | 206.0 | 117.1 | 86.8 | 83.3 | 132.5 | 180.7 | 192.2 | 254.4 | 376.0 |
| 2015 | 489.3 | 593.4 | 399.1 | 236.9 | 99.8 | 85.2 | 68.4 | 95.0 | 124.1 | 206.7 | 225.7 | 307.6 |
| 2016 | 430.2 | 421.3 | 331.9 | 245.4 | 150.6 | 86.9 | 65.8 | 85.5 | 122.9 | 176.2 | 256.5 | 384.0 |
| 2017 | 385.5 | 377.8 | 392.5 | 188.9 | 124.8 | 92.3 | 58.3 | 83.9 | 111.3 | 134.8 | 267.1 | 435.3 |
| 2018 | 545.9 | 381.9 | 334.5 | 246.7 | 91.9 | 69.9 | 51.1 | 60.8 | 116.9 | 224.3 | 348.7 | 440.4 |
| 2019 | 535.9 | 491.3 | 390.6 | 232.5 | 140.0 | 96.0 | 78.0 | 93.7 | 139.8 | 213.0 | 333.0 | 450.7 |
| 2020 | 452.6 | 417.2 | 362.6 | 286.5 | 199.7 | 95.5 | 60.0 | 71.2 | 135.4 | 179.1 | 266.2 | 385.3 |
| 2021 | 410.1 | 481.4 | 360.6 | 196.0 | 131.1 | 81.4 | 55.5 | 75.4 | 111.1 | 163.5 | 263.5 | 390.2 |
| 2022 | 513.7 | 487.0 | 360.8 | |||||||||
| - = No Data Reported; -- = Not Applicable; NA = Not Available; W = Withheld to avoid disclosure of individual company data. |
| Release Date: 5/19/2022 |
| Next Release Date: TBD |